Technical Indicators & Overlays
Technical Indicators & Overlays Introduction Technical Indicators are the often squiggly lines found above, below and on-top-of the price information on a technical chart. Indicators that use the same scale…

Technical Indicators & Overlays Introduction Technical Indicators are the often squiggly lines found above, below and on-top-of the price information on a technical chart. Indicators that use the same scale…

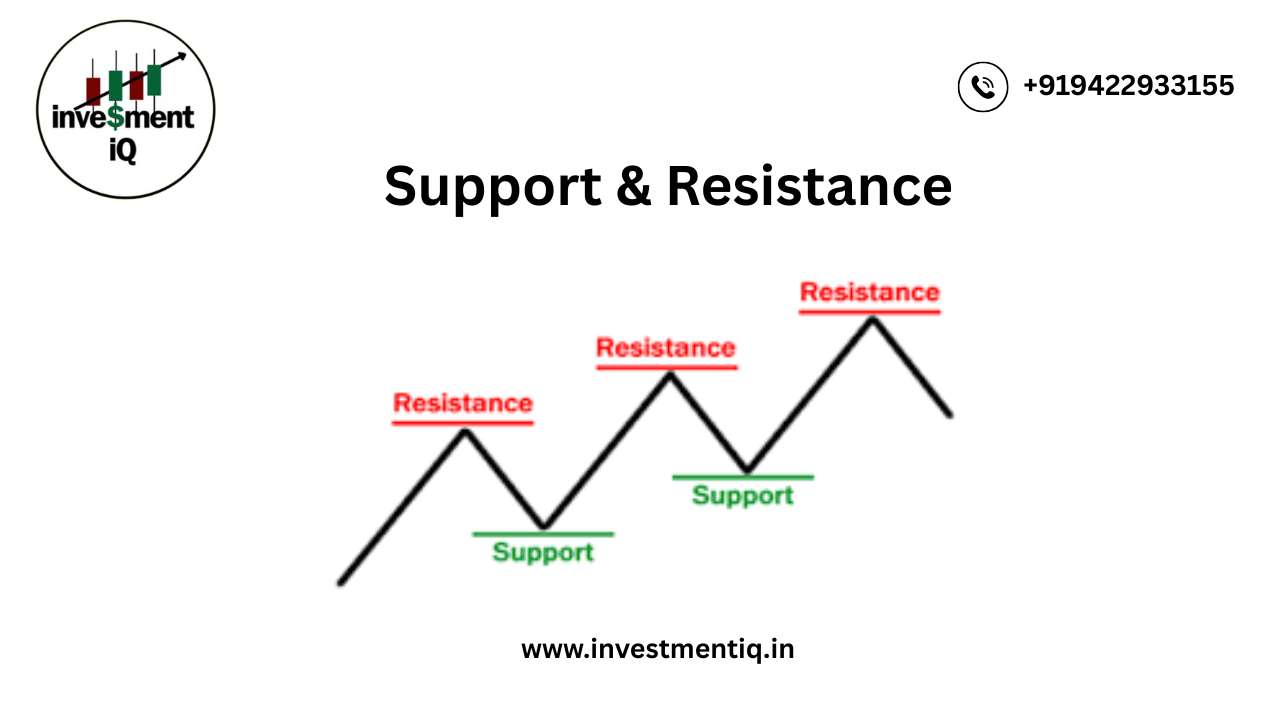
Highs and Lows Support can be established with the previous reaction lows, while resistance can be established by using the previous reaction highs. The below chart of Halliburton (HAL) shows…

Support and Resistance—In Simple Words Key points where supply and demand collide are represented by levels of support and resistance. Excess supply (down) and demand (up) are what drive prices in the financial markets. Bears, selling, and supply are interchangeable. Bullish, bulls, and purchasing are all connected with demand. In this and other articles, these names are used interchangeably. Prices rise in response to rising demand and fall in response to rising supply. Prices fluctuate sideways as bulls and bears battle for power when supply and demand are equal. What Is Support? The price level at which demand is believed to be sufficiently strong to stop further price declines is known as support. According to the rationale, buyers are more likely to purchase and sellers are less likely to sell when the price drops near support and becomes less expensive. Demand is expected to outpace supply by the time the price hits the support level, keeping it from dropping below it. Example of support levels on the chart of Amazon.com, Inc. (AMZN) However, support is not always reliable, and a break below it indicates that the bears have defeated the bulls.…

What Is Correlation? In statistics, correlation measures the degree to which two (or more) variables move together. Positive correlation values indicate movement together in the same direction. Negative correlation values…

How Are Charts Formed? There are different chart types. We will focus on the four most popular charting methods—line, bar, candlestick, and point & figure charts. Line Chart The closing level is more significant to certain traders and investors than the open, high, or low.You can disregard intraday fluctuations by concentrating solely on the closing.…

How to Pick a Timeframe The timeframe for creating a chart depends on the compression of the data—intraday, daily, weekly, monthly, quarterly, or annual. The less compressed the data, the…

Asset Allocation and Diversification What's the best way to minimize your risk while trading? We look at how asset allocation can be combined with technical analysis to ensure a strong…

Random Walk vs. Non-Random Walk Introduction The famous argument between random and non-random walkers is still going strong. These theories are best illustrated by two competing books. Burton Malkiel's 1973 book A Random Walk Down Wall Street is now considered a classic in the field of investment literature. Princeton economist Malkiel contends that investors cannot beat the main indices because price fluctuations are mostly random. Random Walk vs Non-Random Walk The counterargument is presented in the 2001 book A Non-Random Walk Down Wall Street, which was aptly titled by Andrew W. Lo and A. Craig MacKinlay. MacKinlay, a professor of finance at Wharton, and Lo, a professor of finance at MIT, contend that there are predictable components and that price swings are not entirely random. Now let's get the fight started! wanty to learn about technical Analysis in brief Random Walk Theory With…

Strengths of Fundamental Analysis Long-term Trends For long-term investments based on extremely long-term patterns, fundamental analysis works well. Patient investors who choose the appropriate sector groups or companies can gain from the ability to see and forecast long-term changes in the economy, population, technology, or consumer behavior. Learn more about this Value Spotting Finding businesses that offer high value will be made easier with the aid of sound basic analysis. Some of the most renowned investors have a long-term and value-oriented perspective. John Neff, Warren Buffett, and Graham and Dodd are regarded as value investing evangelists. Companies with significant assets, a solid balance sheet, consistent earnings, and longevity can be found with the aid of fundamental research. Business Acumen One of the most obvious, but less tangible, rewards of…
General Steps to Fundamental Evaluation Even though there is no clear-cut method, a breakdown is presented below in the order an investor might proceed. This method employs a top-down approach…