Technical analysis has to do with forecasting future financial price movements based on past price movements. Think of technical analysis like weather forecasting—it doesn’t result in absolute predictions. Instead, investors can use technical analysis to predict what price movements are “likely” to occur over time.
Applying Technical Analysis
Technical analysis can be applied to stocks, indexes, commodities, futures, or any tradable instrument where the price is influenced by supply and demand. Price data (or, as John Murphy calls it, “market action”) refers to any combination of the open, high, low, close, volume, or open interest for a given security over a specific timeframe. The timeframe can be based on intraday (1-minute, 5-minutes, 10-minutes, 15-minutes, 30-minutes, or hourly), daily, weekly, or monthly price data, lasting a few hours or many years
Technical analysis can be applied to charts that show price action over time. The chart below shows a weekly chart of Alphabet Inc. (GOOGL). A weekly chart provides a long-term view of price movement. In the chart of GOOGL, you can see an uptrend and downtrend.
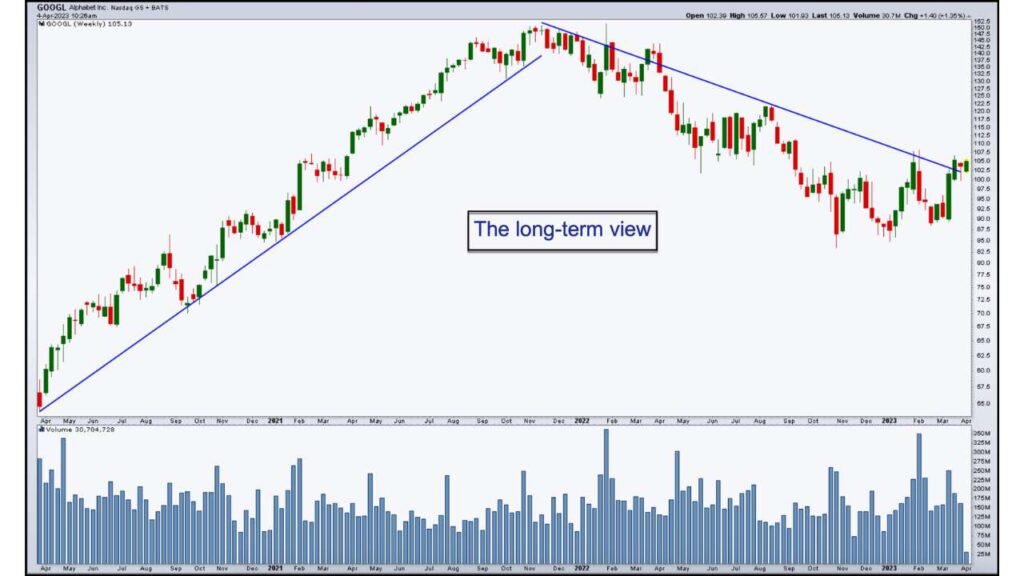
The weekly chart of Alphabet Inc. (GOOGL) shows a long-term uptrend and downtrend.
Below is a daily chart of GOOGL, which shows a shorter-term view of the stock’s price action.
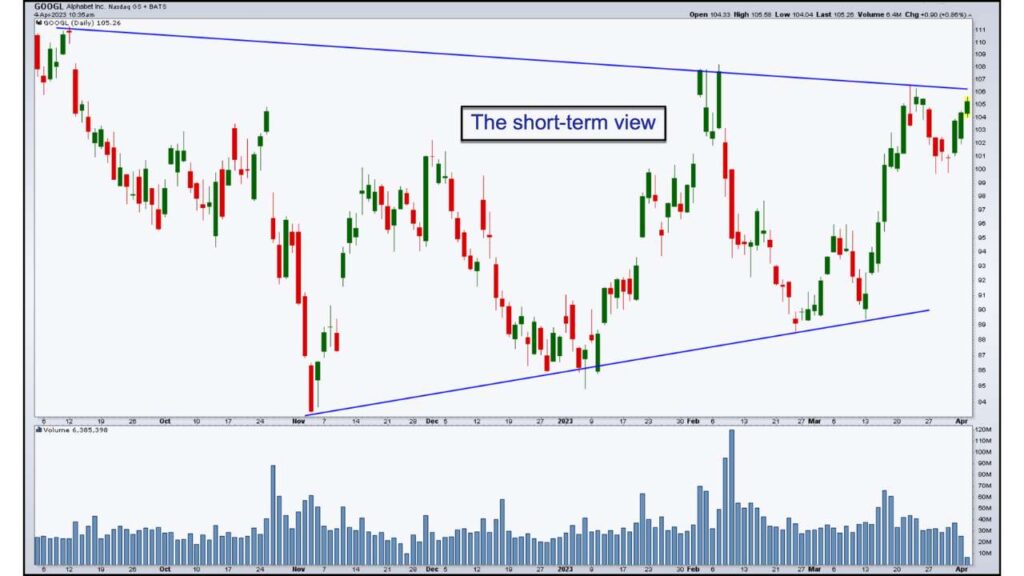
Daily chart of Alphabet Inc. (GOOGL) shows a short-term view of the stock’s price action.
Key Assumptions of Technical Analysis
Technical analysis can be applied to securities where the price is influenced by the forces of supply and demand. When other forces influence the price of a security, technical analysis may not work well. To be successful, technical analysis makes three key assumptions about the securities that are being analyzed:
- Liquidity. Heavily-traded stocks allow investors to trade quickly because there are many buyers and sellers. Thinly-traded stocks are more difficult to trade because there are few buyers or sellers. So, if you’re trying to trade a thinly traded stock, you may have to change your entry or exit price considerably to make a trade. In addition, low-liquidity stocks often trade at a low price (sometimes less than a penny per share), which means that their prices are easier to manipulate. These outside forces acting on thinly-traded stocks make them unsuitable for technical analysis.
- No Artificial Price Changes. Splits, dividends, and distributions are the most common “culprits” for artificial price changes. Though there’s no difference in the value of the investment, artificial price changes can dramatically affect the price chart and make technical analysis difficult to apply. This kind of price influence from outside sources can be easily addressed by adjusting the historical data before the price change.
- No Extreme News. Technical analysis cannot predict extreme events, such as a change in management, regulatory changes, and geopolitical events. When the forces of “extreme news” influence price, technicians have to wait patiently until the chart settles down and starts to reflect the “new normal” that results from such news.
It’s important to determine whether or not a security meets these three requirements before applying technical analysis. That’s not to say that analysis of any stock whose price is influenced by one of these outside forces is useless, but it will affect the accuracy of that analysis.