At the turn of the century, the Dow Theory laid the foundations for what would later become modern technical analysis. Dow Theory wasn’t presented as one complete amalgamation but rather pieced together from the writings of Charles Dow over several years. Of the many theorems put forth by Dow, three stand out:
- Price discounts everything
- Price movements are not random
- “What” is more important than “Why.”
Price Discounts Everything
This theorem is similar to the strong and semi-strong forms of market efficiency. Technical analysts believe that the current price fully reflects all information. Because all information is already reflected in the price, it represents the fair value and should form the basis for analysis. After all, the market price reflects the sum knowledge of all participants—investors, portfolio managers, buy-side analysts, sell-side analysts, market strategists, technical analysts, fundamental analysts, and many others. It would be folly to disagree with the price set by such an impressive array of people with impeccable credentials. Technical analysis utilizes the information captured by the price to interpret what the market is saying with the purpose of forming a view of the future.
Price Movements Are Not Totally Random
Most technicians agree that prices trend. Yet, most technicians also acknowledge that there are times when prices don’t trend. If prices were always random, it would be difficult to make money using technical analysis. In his book, Schwager on Futures: Technical Analysis, Jack Schwager states:
“One way of viewing the situation is that markets may witness extended periods of random fluctuation, interspersed with shorter periods of nonrandom behavior… The goal of the chart analyst is to identify those periods (i.e. major trends).” (p. 12)
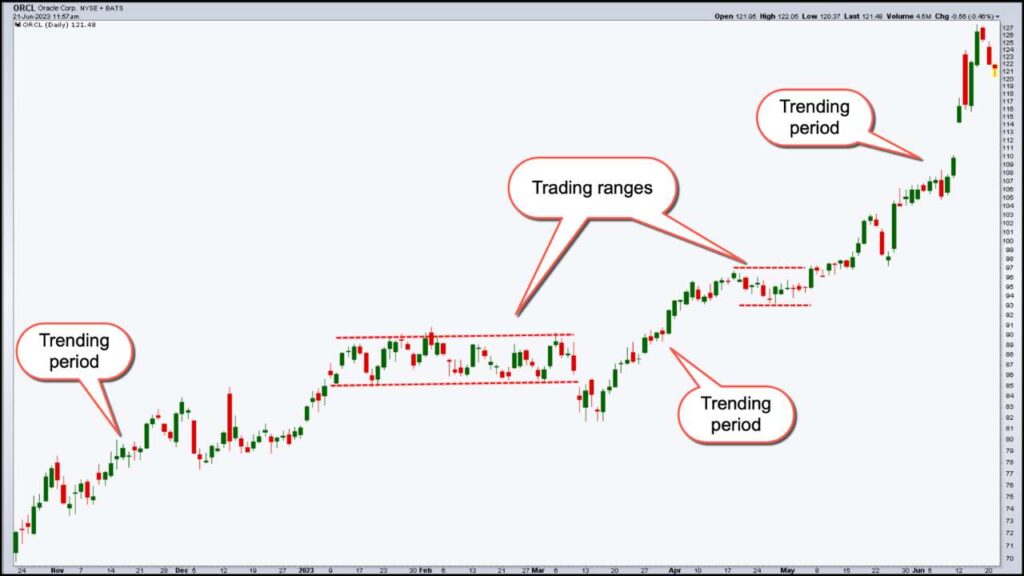
Trending and trading ranges in Oracle (ORCL) example chart from StockCharts.com
A technical analyst believes that it’s possible to identify a trend, invest, or trade based on the trend and make money as the trend unfolds. Because technical analysis can be applied to different timeframes, it’s possible to spot short- and long-term trends.
The chart of ORCL illustrates Schwager’s view on the nature of the trend. The broad trend is up, but it’s also interspersed with trading ranges. In between the trading ranges are smaller uptrends within the larger uptrend. When the stock price breaks above the trading range, the uptrend is renewed. When the stock price breaks below the low of the trading range, a downtrend begins. In the chart above, price broke below the trading range, but it was a short-lived downtrend. The uptrend resumed until the next trading range.
you may be interested in this blog here: