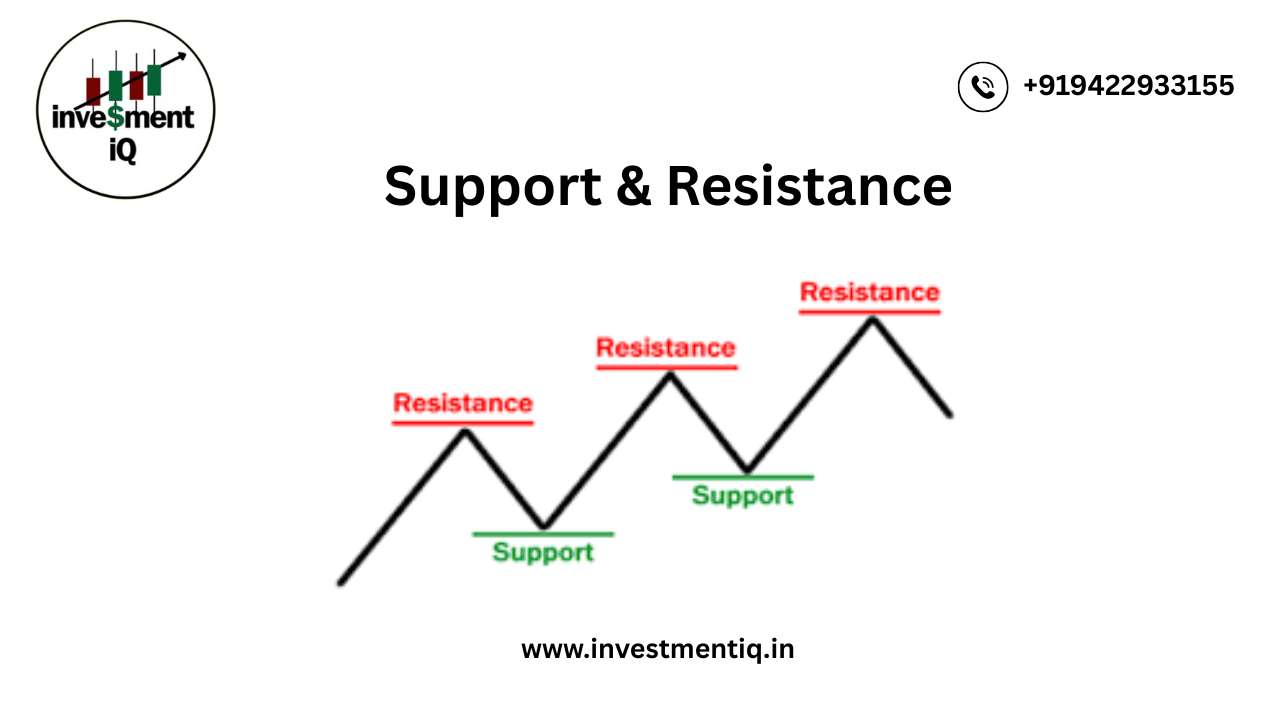
Support and Resistance—In Simple Words
Key points where supply and demand collide are represented by levels of support and resistance. Excess supply (down) and demand (up) are what drive prices in the financial markets. Bears, selling, and supply are interchangeable. Bullish, bulls, and purchasing are all connected with demand. In this and other articles, these names are used interchangeably. Prices rise in response to rising demand and fall in response to rising supply. Prices fluctuate sideways as bulls and bears battle for power when supply and demand are equal.
What Is Support?
The price level at which demand is believed to be sufficiently strong to stop further price declines is known as support. According to the rationale, buyers are more likely to purchase and sellers are less likely to sell when the price drops near support and becomes less expensive. Demand is expected to outpace supply by the time the price hits the support level, keeping it from dropping below it.
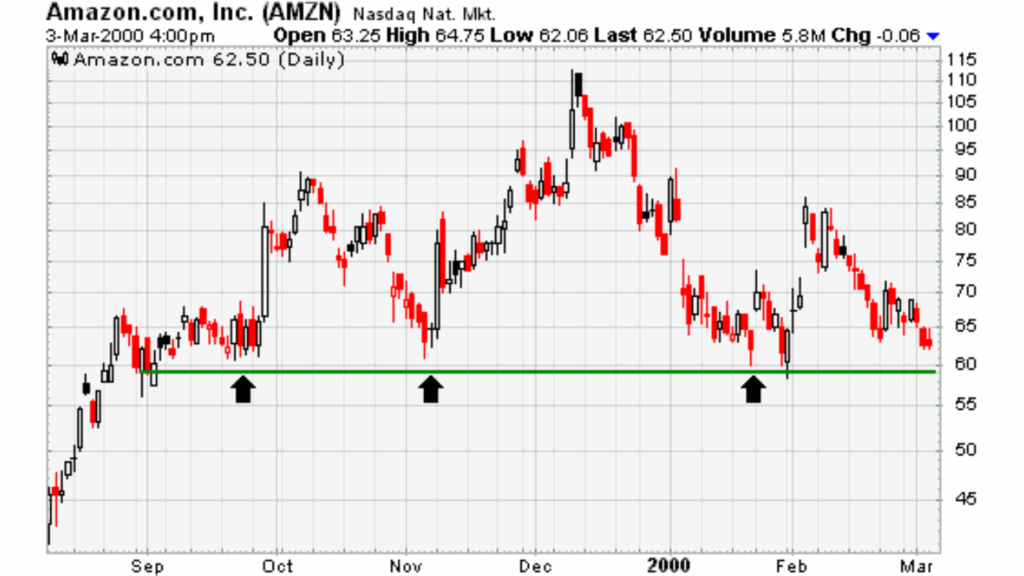
Example of support levels on the chart of Amazon.com, Inc. (AMZN)
However, support is not always reliable, and a break below it indicates that the bears have defeated the bulls. A drop below support suggests a loss of motivation to purchase and/or a new inclination to sell. New lows and support breaks indicate that sellers have lowered their expectations and are prepared to sell at even lower prices. Furthermore, until prices fell below support or the prior low, purchasers could not be forced to purchase. It will be necessary to create a new support level at a lower level after support is broken.
Where Is Support Established?
Support levels are usually below the current price, but it is not uncommon for a security to trade at or near support. As technical analysis is not an exact science, setting precise support levels can often be difficult. In addition, price movements can be volatile and briefly dip below support. For example, it does not seem logical to consider a support level broken if the price closes an eighth below the established support level. For this reason, some traders and investors establish support zones.
What Is Resistance?
The price level at which selling is believed to be powerful enough to stop the price from increasing further is known as resistance. According to logic, sellers are more likely to sell and buyers are less likely to purchase when the price moves closer to resistance. It is thought that supply will outpace demand by the time the price hits the resistance level, preventing the price from climbing above it.
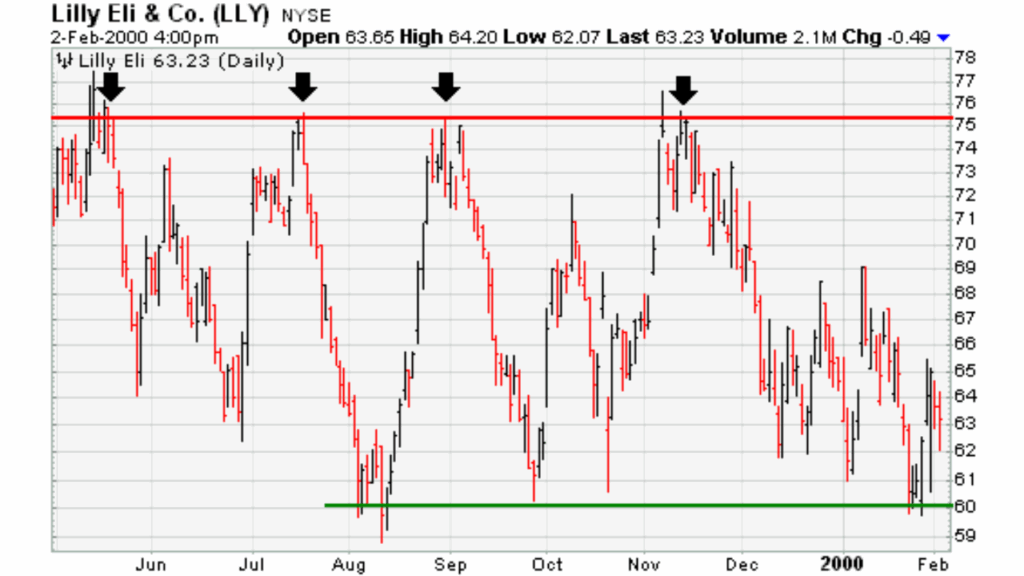
Example of resistance level in a price chart.
A break over resistance indicates that the bulls have defeated the bears, although resistance may not always hold.A break above resistance indicates a lack of motivation to sell and/or a fresh inclination to buy.New highs and resistance breaks show that buyers have raised their expectations and are ppared to pay even more.Furthermore, unless prices surpassed resistance or the prior high, sellers might not be forced to sell.It will be necessary to create a new resistance level at a higher level after resistance has been broken.
Where Is Resistance Established?
Although it is not unusual for a security to trade at or close to resistance, resistance levels are often higher than the current price. Furthermore, price fluctuations can be erratic and momentarily surpass resistance. If the price closes 1/8 above the designated resistance level, it may not always make sense to consider the level broken. Some traders and investors create resistance zones as a result.
you may be interested in ths blog here:-
How to Create a Trading Plan: Example & Risk Management