📌 Table of Contents
- What Is the Stochastic Oscillator?
- Why the Stochastic Oscillator Is Great for Beginners
- How to Read the Stochastic Oscillator
- Real-Life Example of Using the Stochastic Oscillator
- Top Tips for Beginners Using the Stochastic Oscillator
- Where to Learn More
📊 What Is the Stochastic Oscillator?
The Stochastic Oscillator for Beginners is a momentum indicator used in technical analysis. It compares a security’s closing price to its price range over a given period (usually 14 days), helping you spot potential reversals.
It’s ideal for new traders because it’s easy to understand and provides clear buy/sell signals.
Created by George Lane, this indicator helps you answer:
“Is the stock closing near the top or bottom of its recent range?”
💡 Why the Stochastic Oscillator Is Great for Beginners
If you’re just beginning your financial journey, you don’t want complexity. The Stochastic Oscillator for Beginners is:
- Simple – no need for complex math
- Visual – makes interpreting trends easier
- Effective – works well with other indicators like RSI or MACD
According to Investopedia, the stochastic is widely trusted among traders of all levels.
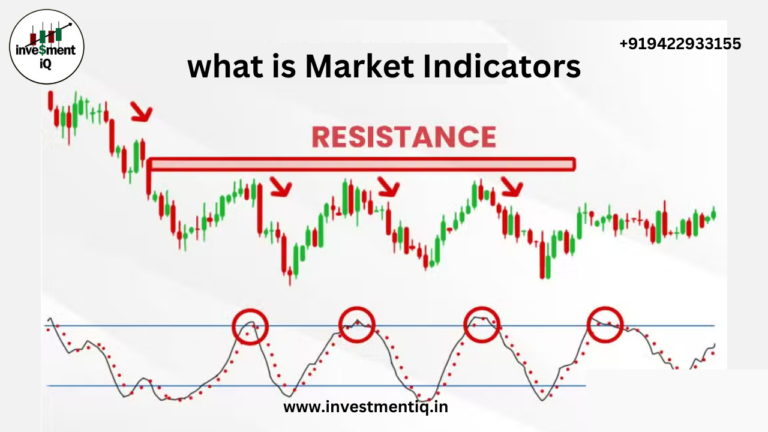
📈 How to Read the Stochastic Oscillator
The oscillator is made up of two lines:
- %K Line: The main, fast-moving line
- %D Line: A 3-day moving average of %K (slow line)
These lines move between 0 and 100.
- Above 80 = Overbought (may indicate a sell opportunity)
- Below 20 = Oversold (may indicate a buy opportunity)
✅ Buy Signal: %K crosses above %D from below
❌ Sell Signal: %K crosses below %D from above
📊 Real-Life Example of Using the Stochastic Oscillator
Let’s take Infosys Ltd as an example:
- Over the last 14 days, price ranged from ₹1,450 to ₹1,600
- Today’s close is ₹1,590
- This places the closing price near the high end, which shows bullish momentum
In this case, if the Stochastic Oscillator is above 80, a reversal might occur soon.
🧠 Top Tips for Using the Stochastic Oscillator for Beginners
- Don’t rely on it alone – Pair it with volume or trend indicators
- Avoid sideways markets – It works best in trending conditions
- Watch crossovers – These are where the gold lies
- Use with stop-losses – Never trade without protection
📷 Image Example
Caption: Stochastic Oscillator example showing %K and %D crossover in a bullish trend
Alt Text: Stochastic Oscillator chart example for beginners
Image Description: A technical chart showing the Stochastic Oscillator (%K and %D lines) crossing over, with oversold and overbought zones for beginners.
🎯 Where to Learn More
Ready to take your trading skills to the next level?
🔗 Explore our free and premium courses on technical indicators
🔗 Read more on MACD vs. PMO: Which Is More Reliable?
🔗 Check out this Investopedia article on Stochastic for more detail
🙌 Final Thoughts
The Stochastic Oscillator for Beginners is one of the best starting points for anyone looking to understand technical analysis. It’s visual, easy to apply, and incredibly insightful once you know how to read it.
📈 Whether you’re investing in stocks, crypto, or ETFs, learning this tool will give you a major edge in 2025.
📞 Contact Us
💬 Have questions?
📧 Email us: admin@investmentiq.in
📞 Call: +91 9422933155
you also intrested in this blog read
What is the Contrast Between Favored Stock and Normal Stock?
Day Trading Guide for August 7, 2024: Intraday supports, resistances for Nifty50 stocks