In the world of trading and investing, market patterns often tell us stories — stories of fear, greed, and opportunity. Among these timeless chart formations, Double Top and Double Bottom stand out as two of the most reliable trend reversal signals that traders use to predict potential changes in market direction.
If you’ve ever felt lost watching a stock climb and suddenly fall, or vice versa, understanding these patterns can be your first step toward reading market psychology like a pro. Whether you’re a beginner investor or a working professional looking to expand financial literacy, this guide will explain everything you need to know — in clear, simple, and actionable terms.
1. Understanding Trend Reversals
Before diving into the patterns themselves, let’s first understand what a trend reversal means.
Markets generally move in trends — uptrends, downtrends, or sideways consolidations.
- An uptrend means prices are making higher highs and higher lows.
- A downtrend means lower highs and lower lows.
However, no trend lasts forever. When buying momentum fades in an uptrend, or selling pressure weakens in a downtrend, the market starts to reverse direction.
That’s where Double Tops and Double Bottoms come into play — they’re like warning signals telling you the current trend is running out of fuel.
2. What is a Double Top Pattern?
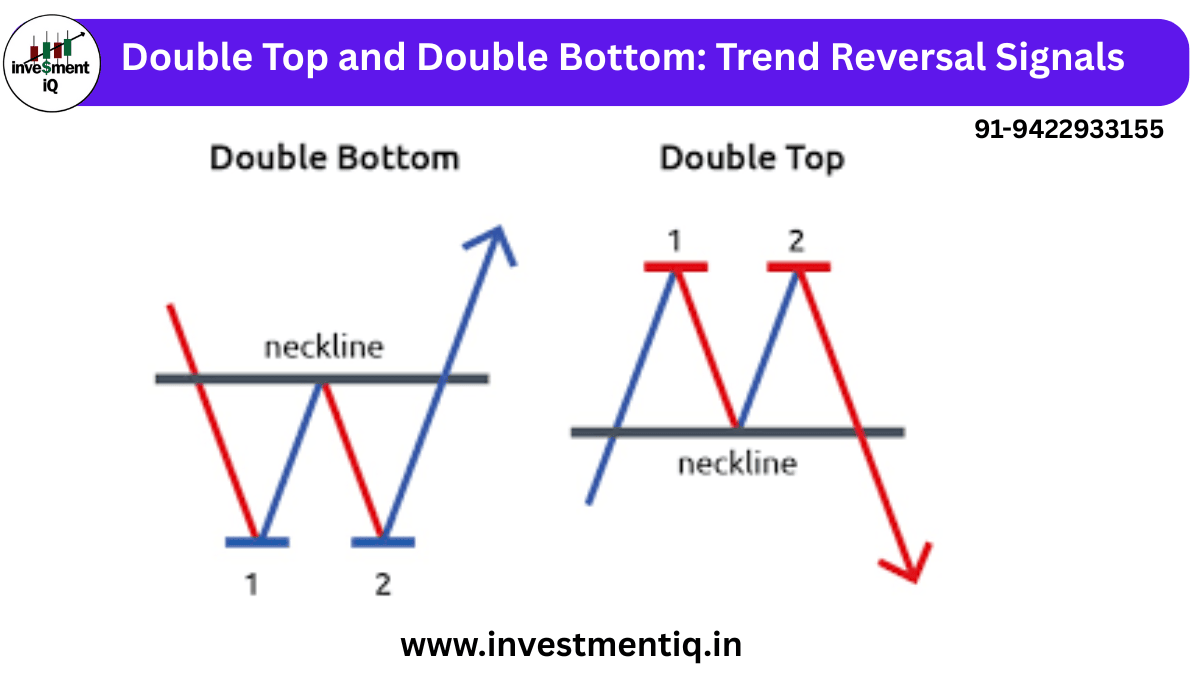
The Double Top is a bearish reversal pattern that signals the end of an uptrend.
Visually, it looks like the letter “M.”
It forms when prices rise to a certain resistance level, pull back, and then rise again to approximately the same level — but fail to break higher.
This failure to surpass the previous high indicates that buyers are losing strength, and sellers are stepping in.
Structure of a Double Top
- First Peak: The market rallies to a resistance level and faces selling pressure.
- Pullback: Prices decline slightly as traders take profits.
- Second Peak: The market tries to break the resistance again but fails.
- Neckline: A line connecting the lowest point between the two peaks.
- Breakdown: When prices fall below the neckline, it confirms the reversal — a potential downtrend has begun.
Trading Example:
Imagine a stock moving from ₹500 to ₹700, forming its first top, then dipping to ₹650.
It tries again to cross ₹700 but fails, returning to ₹650.
When it breaks below ₹650, it confirms the Double Top pattern.
The target can be estimated by subtracting the height of the pattern (₹700 – ₹650 = ₹50) from the neckline (₹650 – ₹50 = ₹600 target).
Moral: The pattern warns traders that the bullish rally is likely over, and a downward shift may begin.
3. What is a Double Bottom Pattern?
The Double Bottom is the bullish twin of the Double Top.
It looks like the letter “W” and signals the end of a downtrend — meaning a potential move upward may follow.
It occurs when prices hit a support level twice and fail to move lower, suggesting that selling pressure has weakened and buyers are regaining control.
Structure of a Double Bottom
- First Trough: Price falls to a support level and bounces slightly.
- Pullback: The market moves upward briefly but then returns to test the same support.
- Second Trough: Price again touches the support but doesn’t fall further.
- Neckline: Drawn across the intermediate high between the two bottoms.
- Breakout: When prices close above the neckline, the reversal is confirmed.
Trading Example:
Suppose a stock drops from ₹600 to ₹400, then rebounds to ₹450, and falls again to ₹400.
If it fails to go lower and later breaks above ₹450, that confirms the Double Bottom pattern.
Your profit target can be projected by adding the height of the pattern (₹450 – ₹400 = ₹50) to the neckline (₹450 + ₹50 = ₹500 target).
Takeaway: This pattern hints that the bearish momentum is exhausted, paving the way for a bullish uptrend.
4. The Psychology Behind Double Tops and Bottoms
Both patterns reveal investor emotions at critical turning points:
- In a Double Top, traders initially believe the rally will continue. When prices fail to exceed the previous high, doubt and fear creep in. As selling accelerates, a reversal begins.
- In a Double Bottom, panic selling dominates early, but when the market refuses to break the previous low, confidence returns, and buyers start taking charge.
In essence, these patterns visualize the battle between bulls and bears, capturing the moment when one side starts to lose control.
5. How to Trade These Patterns Effectively
While the concepts sound simple, success comes from confirmation and patience.
Here’s how to trade safely:
✅ Step 1: Identify the Pattern Clearly
Wait for two distinct highs (Double Top) or lows (Double Bottom). Avoid jumping in before the pattern completes.
✅ Step 2: Confirm the Breakout
For a Double Top, look for a close below the neckline;
for a Double Bottom, a close above the neckline confirms the reversal.
✅ Step 3: Volume Matters
Breakouts with strong trading volume are more reliable. Low volume breakouts often lead to false signals.
✅ Step 4: Measure the Target
The target price equals the height of the pattern projected from the neckline.
✅ Step 5: Use Stop-Loss
- In a Double Top, set your stop-loss just above the second top.
- In a Double Bottom, place it just below the second bottom.
This helps control risk if the pattern fails.
6. Real-World Applications
These patterns appear across all financial markets — stocks, commodities, forex, and cryptocurrencies.
Professional traders, mutual funds, and algorithmic systems use them to detect potential reversals before they gain momentum.
For example:
- Bitcoin often forms Double Bottoms after extended sell-offs.
- Blue-chip stocks like Infosys or Reliance have historically shown Double Tops before major corrections.
At Investment IQ, we emphasize learning these patterns not as isolated signals but as part of a broader technical and psychological framework — where data meets human behavior.
7. Why Every Beginner Should Learn These Patterns
Understanding Double Tops and Bottoms gives you:
- A visual edge to spot reversals before they’re obvious.
- The ability to filter false signals using confirmation and volume.
- Confidence to plan trades logically instead of emotionally.
Whether you’re a beginner trader or a corporate professional seeking financial independence, mastering these patterns adds depth to your understanding of how markets truly behave.
8. Industry Insights: Corporate Relevance
Companies involved in financial analytics, fintech, or investment research often train their teams on chart patterns because:
- They enhance market forecasting accuracy.
- They help design smarter algorithms for price prediction.
- They enable better advisory and portfolio management decisions.
For employees, this knowledge means career growth and professional credibility in finance and analytics roles.
9. Common Mistakes to Avoid
- Ignoring Confirmation: Acting before the neckline breaks can lead to false trades.
- Forgetting Volume Analysis: Low-volume patterns may fail.
- Neglecting Risk Management: Always use stop-loss orders.
- Forcing Patterns: Don’t assume every two highs or lows form a valid setup.
Patience and discipline make these patterns profitable in the long run.
10. Your Next Step Toward Trading Mastery
You’ve just learned one of the most powerful reversal concepts in technical analysis.
But remember — knowledge turns into success only through consistent practice and guided learning.
👉 Take your trading skills to the next level!
Visit Investment IQ today to access expert-led trading courses, technical analysis guides, and market insights designed for learners at every level.
Start your journey toward confident and informed investing — because every great investor begins with understanding the basics.
Conclusion
The Double Top and Double Bottom patterns aren’t just lines on a chart — they’re reflections of market psychology, momentum, and human behavior.
By recognizing them, you don’t just trade better — you think smarter about money, trends, and opportunities.
With patience, practice, and proper education from trusted resources like Investment IQ, you can turn these timeless patterns into stepping stones toward long-term financial growth.