What is Fundamental Analysis?
What is Fundamental Analysis? Fundamental analysis examines the underlying forces that affect the well-being of the economy, industry groups, and companies. As with most analyses, the goal is to derive…

What is Fundamental Analysis? Fundamental analysis examines the underlying forces that affect the well-being of the economy, industry groups, and companies. As with most analyses, the goal is to derive…
Introduction Investing in the stock market can be rewarding, but only if you make informed decisions. Stock analysis helps investors understand the true value and future potential of a company…

When stepping into the world of investing, the first thing most people carry isn’t a strategy—it’s a set of myths. Passed down through friends, media, or outdated advice, these misconceptions…
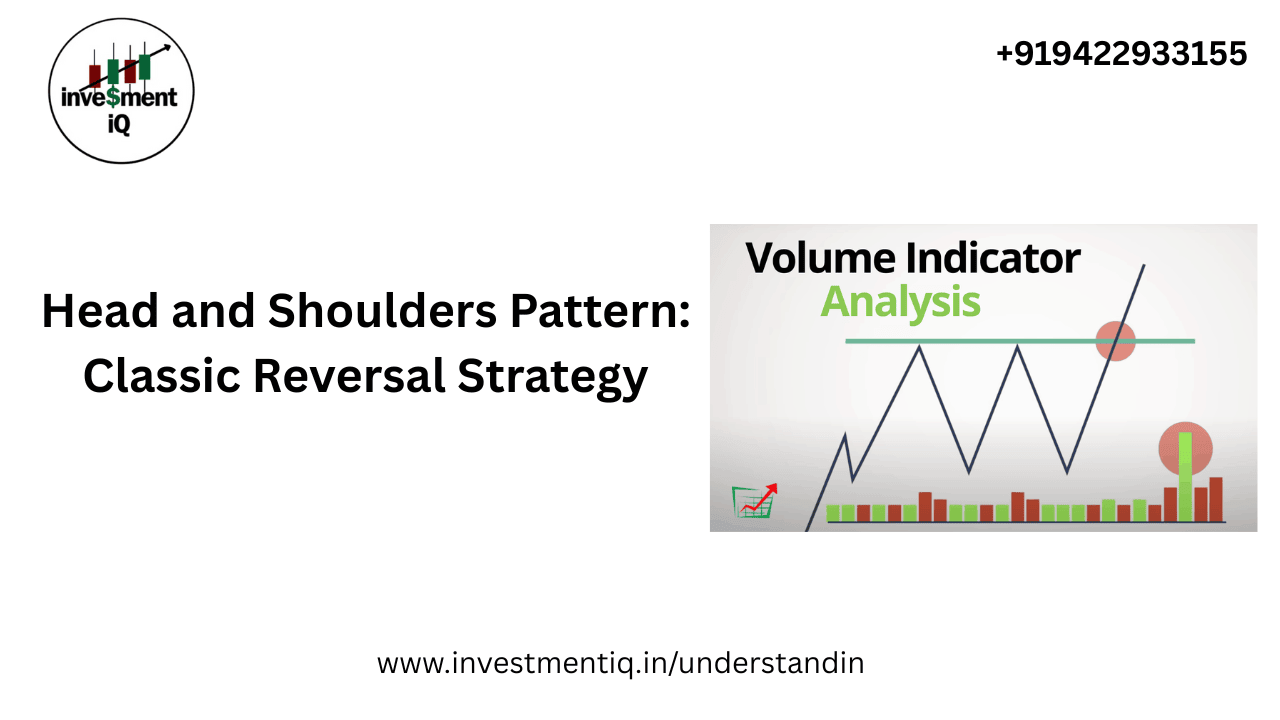
In the world of technical analysis, few patterns are as well-known and reliable as the Head and Shoulders pattern. This classic reversal formation has stood the test of time, helping…

Key Points Stocks represent ownership in public companies; buying shares makes you a part-owner. Stock market prices are driven by supply and demand dynamics. Market makers ensure liquidity, enabling immediate…

Introduction In today’s fast-paced world, many investors seek ways to generate passive income—money earned with minimal ongoing effort. Smart investing can unlock various income streams that require little day-to-day management.…
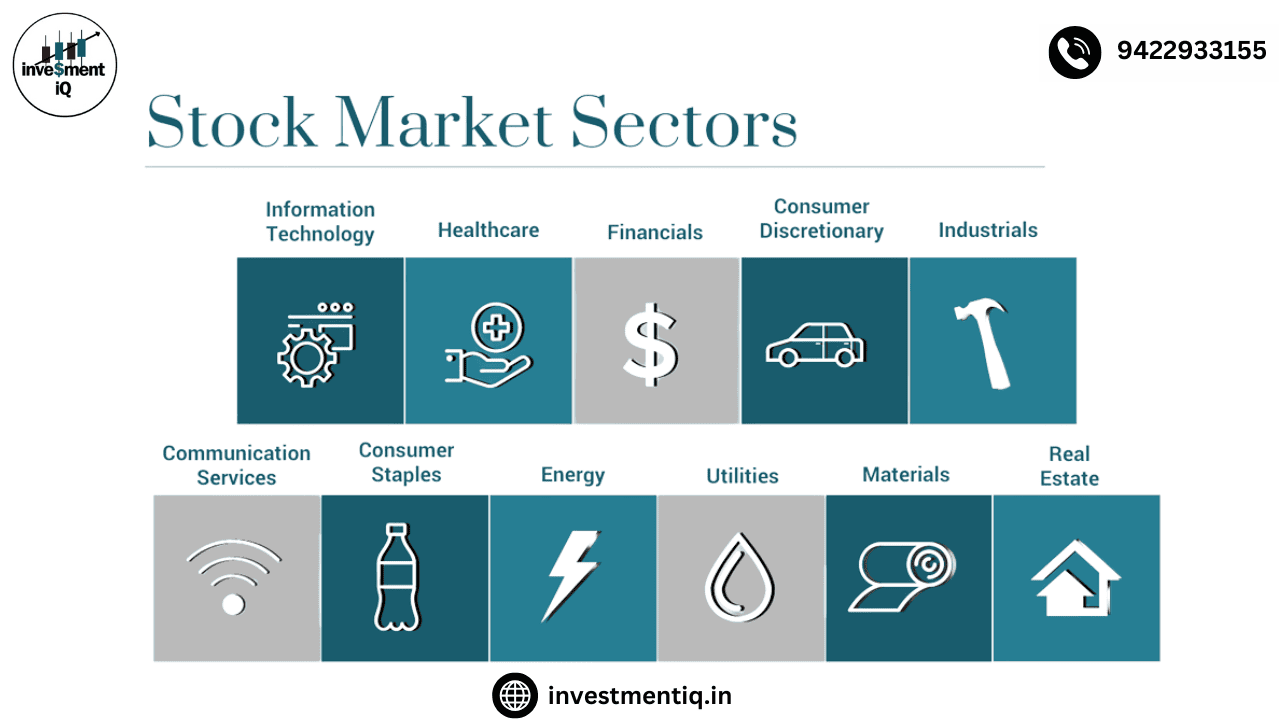
Key Points Sector categorization aids comparability for better investment analysis. Sectors simplify profit evaluation and highlight market trends efficiently. Sector investing via ETFs diversifies portfolios with specific industry exposure. A…

General Steps to Fundamental Evaluation Even though there is no clear-cut method, a breakdown is presented below in the order an investor might proceed. This method employs a top-down approach…

Technical analysis has to do with forecasting future financial price movements based on past price movements. Think of technical analysis like weather forecasting—it doesn't result in absolute predictions. Instead, investors…

Cryptocurrency has been a hot topic for over a decade now, captivating investors, technologists, and speculators alike. Since Bitcoin’s emergence in 2009, the world of digital currencies has expanded exponentially,…