Read more about the article Decision Point Intermediate-Term Breadth Momentum Oscillator (ITBM)
Learn how the ITBM reveals intermediate-term market momentum and breadth strength using DecisionPoint's trusted methodology.

Decision Point Intermediate-Term Breadth Momentum Oscillator (ITBM)

Decision Point Intermediate-Term Breadth Momentum Oscillator (ITBM) Compared to the shorter-term McClellan Oscillator, the ITBM provides a distinct viewpoint on breadth. Carl Swenl in created the Intermediate Term Breadth Momentum Oscillator (ITBM) to offer an alternative viewpoint for interpreting the McClellan  Oscillator. This indicator is computed using the Ratio-Adjusted version of the McClellan Oscillator. Welcome to Part our Technical Analysis 101 Series – “Dominate the Markets with Smart Technical Analysis”! Calculating…

Continue ReadingDecision Point Intermediate-Term Breadth Momentum Oscillator (ITBM)
Read more about the article Arms Index (TRIN)
⚖️ Is buying or selling pressure dominating the market? The Arms Index (TRIN) helps traders spot market extremes and short-term reversals with volume-weighted accuracy. 🔍 A powerful tool for intraday and swing traders.

Arms Index (TRIN)

What Is the Arms Index (TRIN)? The Arms Index, also known as the TRIN or Short-Term TRading INdex, is a breadth indicator developed by Richard W. Arms in 1967. The…

Continue ReadingArms Index (TRIN)
Read more about the article Advance-Decline Volume Percent
📊 Want to know if market volume is truly behind the move? The Advance-Decline Volume Percent tells you how much buying or selling power is driving the trend. ✔️ A must-use indicator for serious technical traders.

Advance-Decline Volume Percent

Advance-Decline Volume Percent A breadth indicator that measures the percentage of net advancing within a particular group, such as a SPDR or index ETF. you want to learn more about…

Continue ReadingAdvance-Decline Volume Percent
Read more about the article Advance-Decline Volume Line
📈 Not all rallies are created equal — volume tells the real story. The Advance-Decline Volume Line reveals if the majority of trading volume supports the trend. 🔍 Use it to confirm strength or spot hidden weakness.

Advance-Decline Volume Line

Advance-Decline Volume Line A cumulative breadth indicator derived from Net Advancing Volume. What Is the Advance-Decline Volume Line? The Advance-Decline Volume Line (AD Volume Line) is a breadth indicator based…

Continue ReadingAdvance-Decline Volume Line
Read more about the article Advance-Decline Percent
📊 Want a quick snapshot of market strength or weakness? The Advance-Decline Percent gives you real-time insight into market breadth with just one number. ✔️ Learn how it helps confirm trends or warn of reversals.

Advance-Decline Percent

Advance-Decline Percent An index ETF or SPDR is an example of a breadth indicator that calculates the proportion of net advances within a specific group. What Is the Advance-Decline Percent Indicator? The Advance-Decline Percent is a breadth indicator that measures the percentage of net advances. After the market close, StockCharts.com calculates this…

Continue ReadingAdvance-Decline Percent
Read more about the article Advance-Decline Line
📉 Is the market rally really strong — or just driven by a few stocks? The Advance-Decline Line (A/D Line) reveals the truth behind the trend! 🔍 Learn how this powerful indicator uncovers market strength or weakness.

Advance-Decline Line

Advance-Decline Line The Advance-Decline Line (AD Line) is a breadth indicator based on Net Advances. What Is the Advance-Decline Line? The Advance-Decline Line (AD Line) is a breadth indicator based…

Continue ReadingAdvance-Decline Line
Read more about the article Market Indicators in-2025
📊 The market in 2025 is driven by more than just price action. Stay ahead with the latest economic indicators that matter — inflation, interest rates, and more. 📉📈 🔍 Know what smart traders and investors are watching this year!

Market Indicators in-2025

Market Indicators in-2025 Market Indicators are datasets that contain metadata about the health of various markets or groups of related stocks. Examples include “Advancers,” “Decliners” and the “McClellan Summation Index.”…

Continue ReadingMarket Indicators in-2025
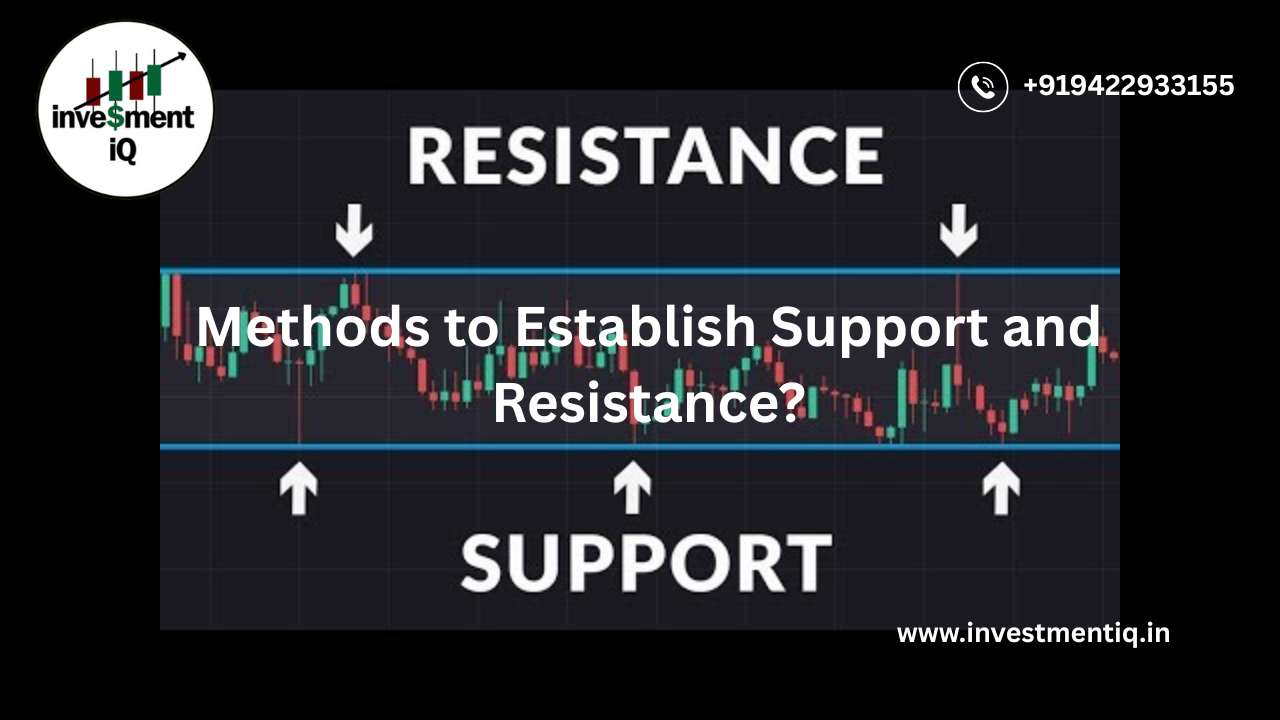
Read more about the article Methods to Establish Support and Resistance?
📊 Not all support & resistance levels are obvious! Learn proven methods — from trendlines to Fibonacci retracements — to identify key price zones with confidence. 🚀

Methods to Establish Support and Resistance?

Highs and Lows Support can be established with the previous reaction lows, while resistance can be established by using the previous reaction highs. The below chart of Halliburton (HAL) shows…

Continue ReadingMethods to Establish Support and Resistance?
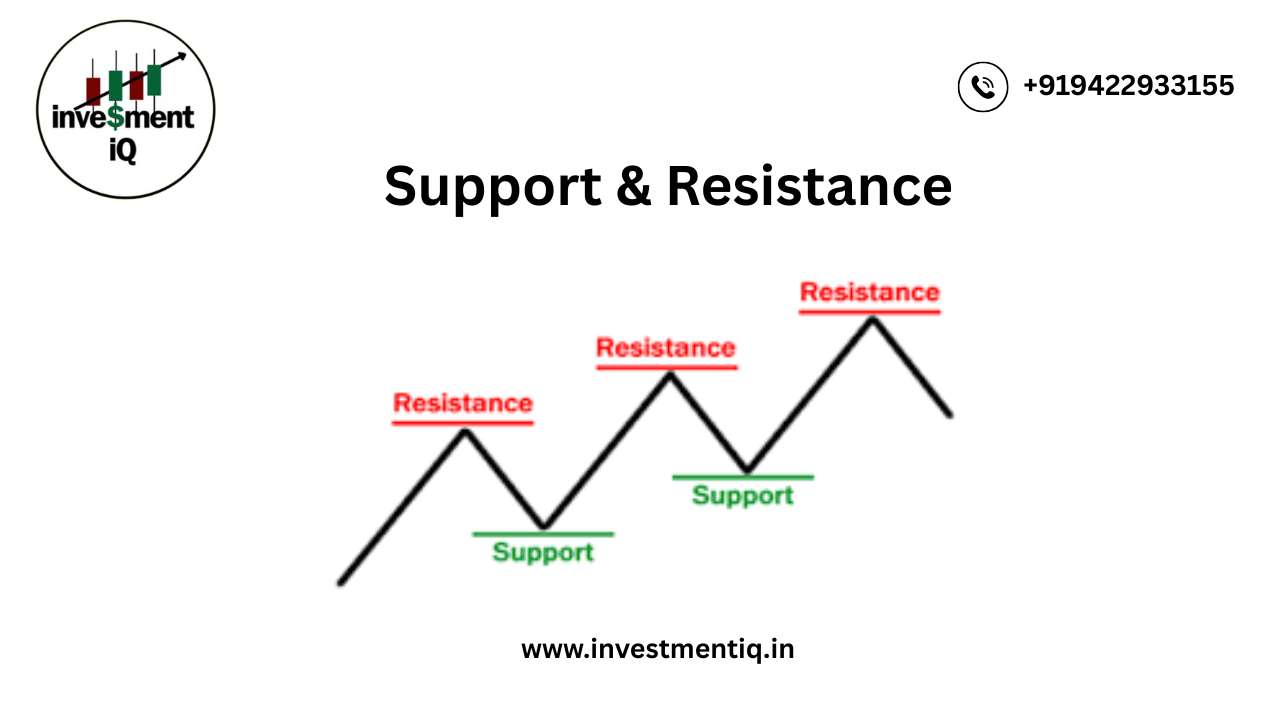
Read more about the article Understanding Support & Resistance in Trading in-2025
📉📈 Price keeps bouncing at certain levels? That’s no coincidence — it's support and resistance at work! Learn how to spot these key zones and use them to plan better entries and exits. 🔍💡

Understanding Support & Resistance in Trading in-2025

Support and Resistance—In Simple Words Key points where supply and demand collide are represented by levels of support and resistance. Excess supply (down) and demand (up) are what drive prices in the financial markets. Bears, selling, and supply are interchangeable. Bullish, bulls, and purchasing are all connected with demand. In this and other articles, these names are used interchangeably. Prices rise in response to rising demand and fall in response to rising supply. Prices fluctuate sideways as bulls and bears battle for power when supply and demand are equal. What Is Support? The price level at which demand is believed to be sufficiently strong to stop further price declines is known as support. According to the rationale, buyers are more likely to purchase and sellers are less likely to sell when the price drops near support and becomes less expensive. Demand is expected to outpace supply by the time the price hits the support level, keeping it from dropping below it. Example of support levels on the chart of Amazon.com, Inc. (AMZN) However, support is not always reliable, and a break below it indicates that the bears have defeated the bulls.…

Continue ReadingUnderstanding Support & Resistance in Trading in-2025
Read more about the article Why and How To Use Correlation
🔗 Did you know some assets move together or opposite each other? That’s correlation — a powerful tool to manage risk and spot trading opportunities. 📊 Learn how to use it to your advantage!

Why and How To Use Correlation

What Is Correlation? In statistics, correlation measures the degree to which two (or more) variables move together. Positive correlation values indicate movement together in the same direction. Negative correlation values…

Continue ReadingWhy and How To Use Correlation