Ever wished you could catch a stock just before it makes a massive move?
Welcome to the exciting world of momentum trading a strategy built on the idea that “what’s moving will keep moving.” Whether you’re an aspiring trader or a professional looking to refine your edge, understanding momentum can help you ride the wave of market trends instead of fighting against them.
In this guide, we’ll break down what momentum trading is, the best indicators used to identify strong moves, and practical tips for applying this strategy effectively in real-world markets.
🔍 What Is Momentum Trading?
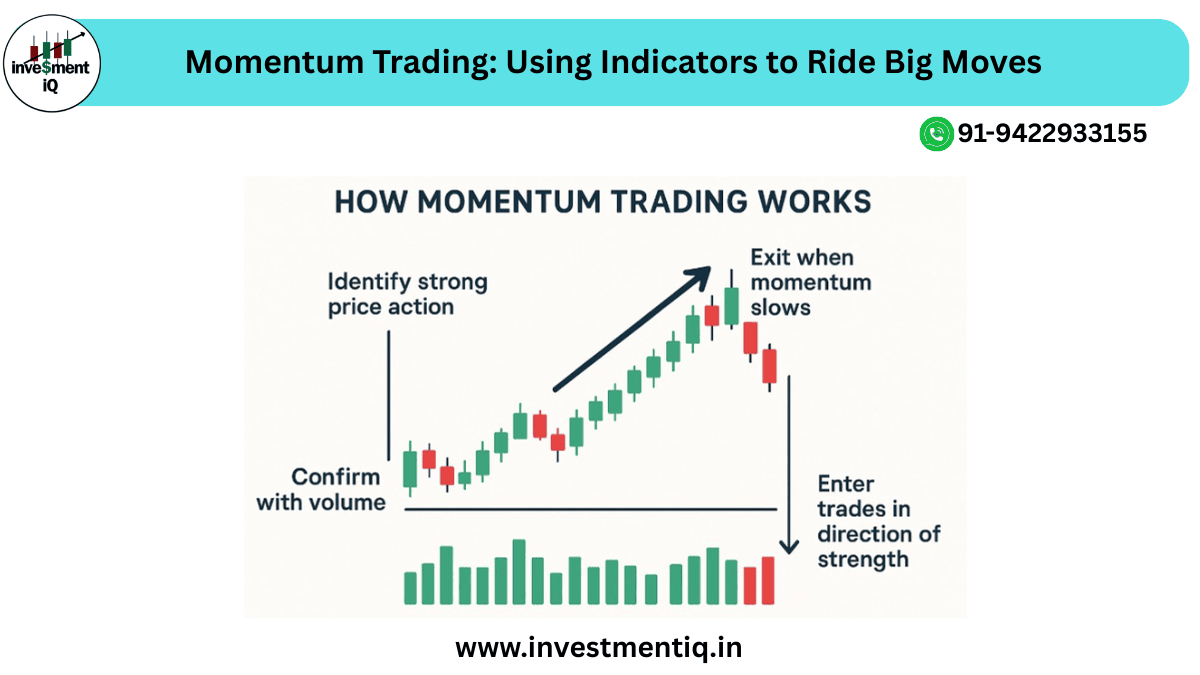
Momentum trading is a strategy that focuses on buying stocks (or assets) showing strong upward price movements and selling them when the momentum fades.
The logic is simple: when prices move strongly in one direction, they tend to keep going — at least for a while.
Momentum traders don’t care much about long-term fundamentals. Instead, they look for:
- Stocks with high trading volume
- Rapid price acceleration
- Strong investor sentiment
This strategy is often summarized by the famous saying —
“The trend is your friend until it bends.”
⚙️ The Core Principle Behind Momentum
Momentum is all about speed and strength of price movement.
Just like in physics — where momentum depends on mass and velocity — in trading, it depends on volume (how many traders are involved) and price speed (how quickly the price is changing).
The stronger the force, the longer it tends to last.
This is why traders try to catch the middle of a move, not the exact top or bottom.
📈 Top Momentum Indicators You Should Know
Let’s dive into the key technical tools used by traders to measure momentum.
1. Relative Strength Index (RSI)
- Purpose: Measures the speed and change of price movements.
- Scale: 0–100
- Signal:
- RSI > 70 → Overbought (momentum may fade soon)
- RSI < 30 → Oversold (momentum may reverse upward)
- RSI > 70 → Overbought (momentum may fade soon)
- Use Tip: In strong uptrends, RSI can stay above 70 for extended periods don’t rush to sell.
Example:
If the RSI of a stock is 80 and the price keeps rising, it shows strong bullish momentum. Traders may stay in the trade until signs of reversal appear.
2. Moving Average Convergence Divergence (MACD)
- Purpose: Tracks the relationship between two moving averages.
- Components: MACD Line, Signal Line, and Histogram
- Signal:
- Bullish when MACD Line crosses above Signal Line
- Bearish when MACD Line crosses below Signal Line
- Bullish when MACD Line crosses above Signal Line
Pro Tip:
Look for MACD histogram expansion — it means momentum is accelerating.
3. Rate of Change (ROC)
- Purpose: Measures the percentage change in price over a specific period.
- Signal:
- ROC rising → bullish momentum
- ROC falling → bearish momentum
- ROC rising → bullish momentum
- Use Case: Excellent for spotting divergence between price and momentum.
4. Stochastic Oscillator
- Purpose: Compares a closing price to its range over time.
- Signal:
- Above 80 → Overbought
- Below 20 → Oversold
- Above 80 → Overbought
- Use Tip: Look for crossovers in overbought/oversold zones for momentum shifts.
5. Commodity Channel Index (CCI)
- Purpose: Detects new trends and extreme conditions.
- Signal:
- CCI > +100 → Strong upward momentum
- CCI < –100 → Downward momentum
- CCI > +100 → Strong upward momentum
- Use Tip: Combine with volume indicators to confirm strength.
💡 How to Apply Momentum Trading in Real Markets
Momentum trading is more than just following indicators. Here’s a practical approach to apply it wisely:
✅ Step 1: Identify a Strong Trend
Use moving averages (like 20-day and 50-day) to confirm whether the market is in an uptrend or downtrend.
✅ Step 2: Confirm with Momentum Indicators
Check RSI, MACD, or ROC to validate that momentum supports the direction of the trend.
✅ Step 3: Use Volume for Validation
Momentum without volume is weak. Look for rising volumes to confirm the strength of the move.
✅ Step 4: Time Your Entry
Enter during minor pullbacks in the direction of the trend — not at the top of the rally.
✅ Step 5: Manage Risk
Always set a stop-loss below the recent swing low (for long trades) or above the swing high (for short trades).
📊 Example: Riding the Momentum Wave
Imagine a stock trading at ₹500 suddenly breaks out above ₹520 with high volume.
- RSI shows 68 (approaching strong momentum)
- MACD gives a bullish crossover
- Volume spikes 40% above the average
This is a classic momentum setup — a trader can buy near ₹522 and ride the move till momentum starts slowing, say around ₹560.
The key here is discipline and timing, not prediction.
🚀 Benefits of Momentum Trading
- ✅ Quick returns in trending markets
- ✅ Clear technical rules for entries and exits
- ✅ Works across stocks, forex, crypto, and commodities
- ✅ Ideal for active traders who love fast-paced action
⚠️ Common Mistakes to Avoid
- Ignoring Volume: Momentum without participation is a trap.
- Chasing the Peak: Entering too late can reverse quickly.
- Skipping Risk Management: Always protect your capital.
- Overusing Indicators: Simplicity often wins in momentum trading.
🌍 Momentum Trading in Different Markets
- Stocks: Ideal during earnings season or post-breakout.
- Forex: Use momentum to ride currency strength.
- Crypto: Perfect for identifying parabolic moves and corrections.
Each market has its rhythm — momentum indicators help you tune in to it.
💬 Pro Tip: Combine Indicators for Accuracy
No single indicator guarantees success.
For example:
- Use RSI for momentum strength,
- MACD for trend confirmation,
- Volume for validation.
This multi-layered approach increases your success probability significantly.
🎯 Conclusion: Ride the Trend, Don’t Fight It
Momentum trading isn’t about guessing the top or bottom — it’s about capturing the middle of big market moves.
When done right, it can help you maximize profits while keeping your strategy structured and disciplined.
Whether you’re a beginner or an experienced trader, start small, practice your analysis, and let momentum be your guide toward financial freedom.
💡 Want to master momentum indicators in depth?
Explore advanced courses and trading insights at InvestmentIQ.in — your trusted source for learning the art of trading with confidence.
you may be interested in this blog here:-
Full Stack Development Salary in India – 2024 Trends and Insights
Salesforce Developer Salary in India An In-Depth Analysis