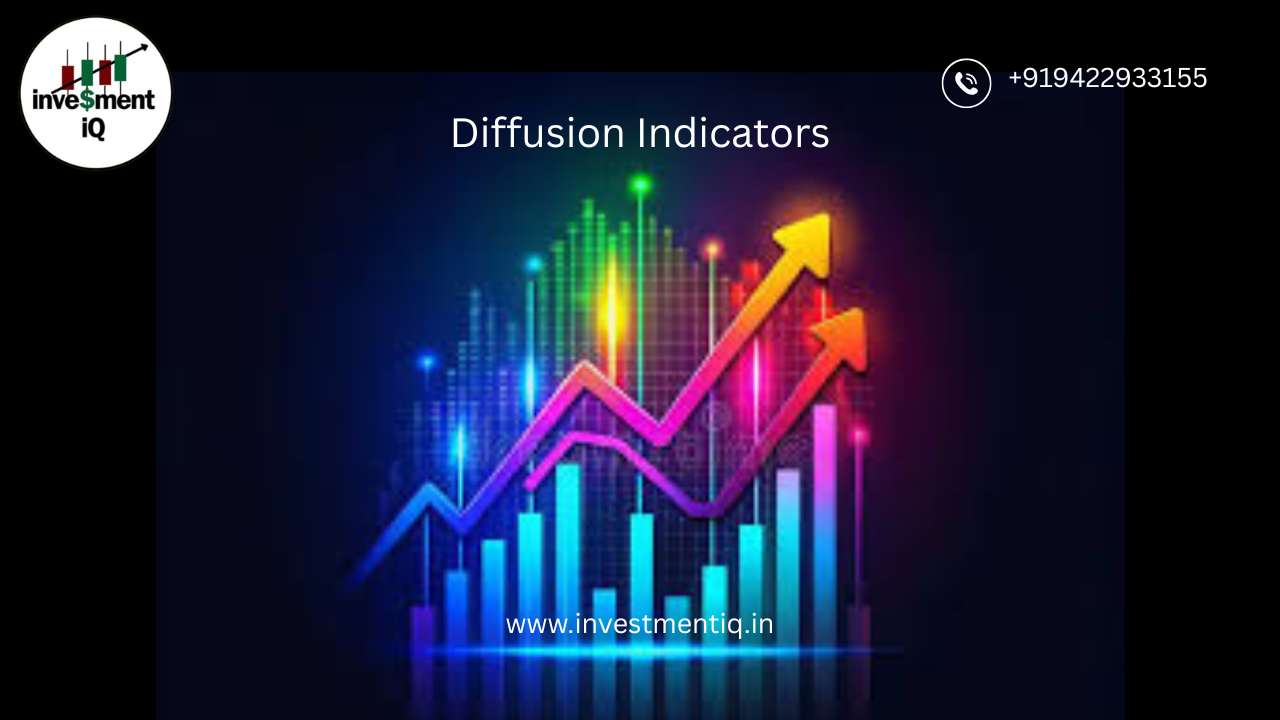
Percent Above Moving Average
Percent Above Moving Average The percentage of stocks above a given moving average is shown by a breadth oscillator. Percentage of Stocks Above a Moving Average: Internal Market Strength or Weakness It would be useful to know whether there is internal strength supporting an index's continued upward trajectory. One market breadth indicator that may be used to gauge the internal strength or weakness of an underlying index is the proportion of stocks that are trading above a particular moving average. The percentage of companies trading above the 50-day moving average is useful for short-to-medium-term timeframes. It's better to examine the proportion of companies trading above the 150- and 200-day moving averages for medium- to long-term periods. Bullish/bearish divergences, overbought/oversold levels, and crossovers above/below 50% can all provide trading indications.For the Dow, Nasdaq, Nasdaq 100, NYSE, S&P 100, S&P 500, and S&P/TSX Composite, the indicator is accessible. The percentage of stocks over their 50-, 150-, or 200-day moving averages can be plotted by users of SharpCharts. This article ends with a complete list of symbols. Calculating Percentage Above MA Copy (number…