Ever wondered why stock prices move up and down even when there’s no major news?
Why do traders panic-sell one day and chase prices the next?
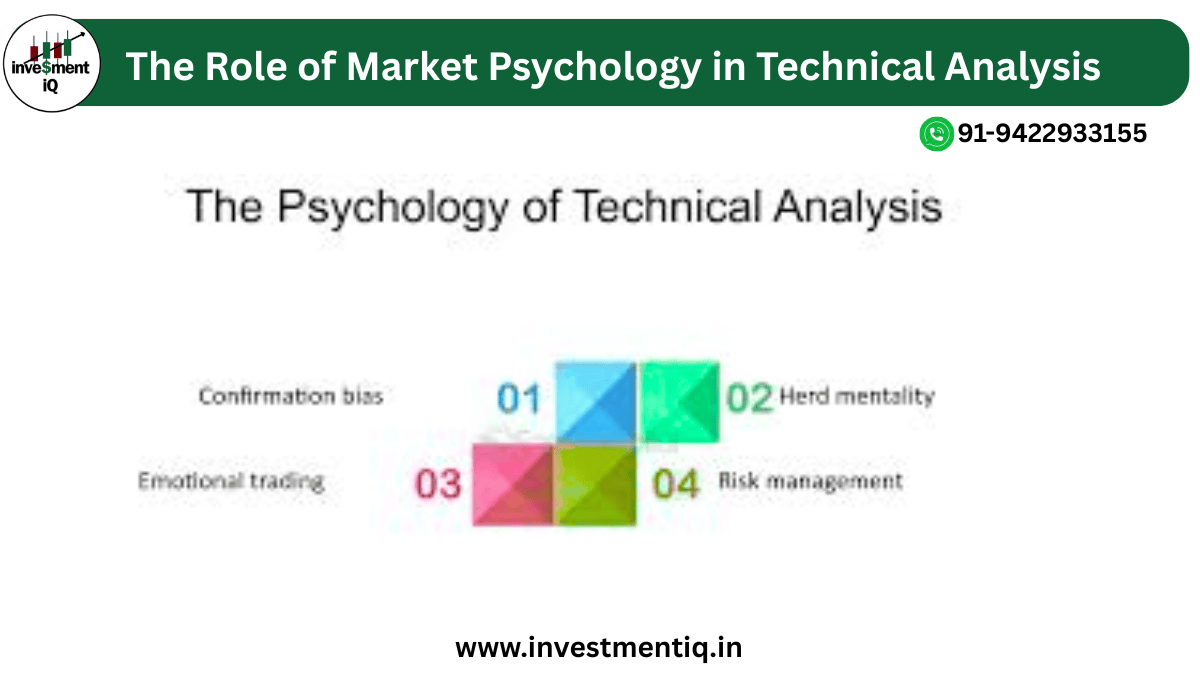
The answer lies in market psychology — the emotional and behavioral forces driving every buying and selling decision. Technical analysis, though rooted in charts and data, is ultimately a reflection of human emotion and crowd behavior.
In this blog, we’ll explore how understanding market psychology helps traders interpret patterns, manage emotions, and make smarter investment decisions.
💭 What Is Market Psychology?
Market psychology refers to the collective sentiment and behavior of investors and traders in the financial markets. It’s the emotional temperature that influences how people act during bullish or bearish phases.
In simple terms:
- When optimism dominates → markets rise
- When fear spreads → markets fall
This pattern repeats over time, creating recognizable technical formations like head and shoulders, double tops, and flags — all rooted in collective human behavior.
📊 How Psychology and Technical Analysis Are Connected
Technical analysis isn’t just about numbers and charts — it’s about decoding emotions hidden within price movements. Every candle, line, or bar on a chart represents what thousands of investors are feeling at a given moment:
- Fear,
- Greed,
- Hope,
- Regret.
When you study charts, you’re not just studying prices — you’re studying human behavior in action.
Example:
When prices rise sharply and trading volume spikes, it often means:
- Fear of missing out (FOMO) is pushing traders to buy.
When prices suddenly drop: - Panic and fear cause massive sell-offs.
These emotions are what make the markets move — not just fundamentals.
🧩 The Emotional Cycle of the Market
Understanding the emotional market cycle is one of the most powerful tools for traders. It usually goes like this:
- Optimism – Investors start believing the market will rise.
- Excitement – Early profits create confidence.
- Euphoria – Greed peaks; “This time it’s different!”
- Anxiety – Price corrections begin; confidence weakens.
- Denial – Traders hold losing positions, expecting recovery.
- Fear – Selling pressure builds up.
- Panic – Massive sell-offs occur.
- Despondency – Market bottoms; no one wants to buy.
- Hope – Early signs of recovery appear again.
This cycle repeats across years, months, or even intraday charts — and it’s what creates most technical patterns traders rely on.
⚙️ Psychological Foundations Behind Common Chart Patterns
1. Head and Shoulders Pattern
This formation represents a shift from optimism to fear.
- The left shoulder forms as traders buy optimistically.
- The head shows peak confidence.
- The right shoulder signals fading enthusiasm and growing fear.
When the price breaks the neckline, it reflects collective realization — the uptrend is over.
2. Double Top and Double Bottom
These patterns reflect human hesitation.
- A double top shows that traders tried to push prices up twice but failed — indicating exhaustion.
- A double bottom reflects renewed hope after two failed declines.
3. Flag and Pennant Patterns
After a strong price surge, traders take short-term profits, causing consolidation.
This brief pause (flag or pennant) shows psychological cooling, before the majority realize the trend is still intact — and the move resumes.
4. Support and Resistance Levels
Support and resistance aren’t magical numbers — they’re psychological price zones.
- Support: Levels where traders feel the price is “cheap.”
- Resistance: Levels where traders believe the price is “too high.”
These zones form as emotions repeat across multiple timeframes.
📉 Fear and Greed: The Twin Forces of Market Behavior
At the heart of market psychology are two universal emotions:
🧠 Fear
- Causes premature selling or missing out on profitable opportunities.
- Leads to overreaction during market downturns.
💰 Greed
- Pushes traders to buy overpriced assets expecting infinite profits.
- Creates bubbles and unrealistic expectations.
Balancing these emotions is the mark of a disciplined trader.
🔎 How to Use Market Psychology in Technical Analysis
1. Recognize Emotional Extremes
When everyone around you is overly optimistic, the market may be near a top.
When panic dominates, you might be close to a bottom.
2. Follow the Volume
Volume reflects conviction. A rising price with high volume shows strong belief.
Falling prices with low volume might mean the correction is temporary.
3. Use Sentiment Indicators
Indicators like the Fear and Greed Index or Put/Call Ratios help gauge collective emotions beyond charts.
4. Confirm with Technical Patterns
Psychology shows why something happens; technical analysis shows when it happens.
Use both to confirm your trades.
🧘 Managing Your Own Psychology as a Trader
To succeed in trading, it’s not enough to read market emotions — you must control your own.
Here are some actionable tips:
- Create a trading plan and stick to it.
- Use stop-loss orders to manage fear and greed.
- Journal your trades — track your thoughts and emotions.
- Avoid impulsive decisions — patience often pays off.
Remember: your biggest opponent in trading isn’t the market — it’s your own psychology.
🌍 Real-World Examples of Market Psychology
Example 1: The 2020 COVID Crash
Fear of uncertainty led to one of the fastest sell-offs in history. But shortly after, optimism returned as traders anticipated recovery — a perfect case of emotional overreaction followed by correction.
Example 2: The Crypto Bull Run
Bitcoin’s rally from 2020 to 2021 was fueled by FOMO and greed, as new traders rushed in, followed by panic-selling when prices corrected in 2022.
Both cases highlight that human emotion drives markets more than data.
💬 Pro Tip: Combine Technicals with Psychology
The best traders blend both worlds:
- Technical indicators tell you what’s happening.
- Market psychology explains why it’s happening.
When combined, they offer a powerful perspective that helps you time entries and exits with confidence.
🎯 Conclusion: The Human Side of Every Chart
Technical analysis is more than just math and lines it’s a story of human behavior written in prices.
Understanding market psychology helps you interpret those stories, anticipate crowd reactions, and build emotional discipline.
Whether you’re a beginner or seasoned investor, learning to read market emotions will give you a lasting edge in trading.💡 Want to master trading psychology and technical analysis together?
Explore expert-led courses and trading insights at InvestmentIQ.in your guide to smart investing and market mastery.