When it comes to understanding market momentum, traders often turn to indicators like RSI or MACD. But there’s one hidden gem that deserves more attention — the Commodity Channel Index (CCI).
Despite its name, the CCI isn’t limited to commodities. It’s a versatile momentum indicator that works beautifully for stocks, forex, and indices, helping traders spot overbought, oversold, and trend reversal opportunities.
In this ultimate guide, we’ll simplify everything you need to know about the Commodity Channel Index, how it works, and how you can use it to make smarter, more confident trading decisions — even if you’re a beginner.
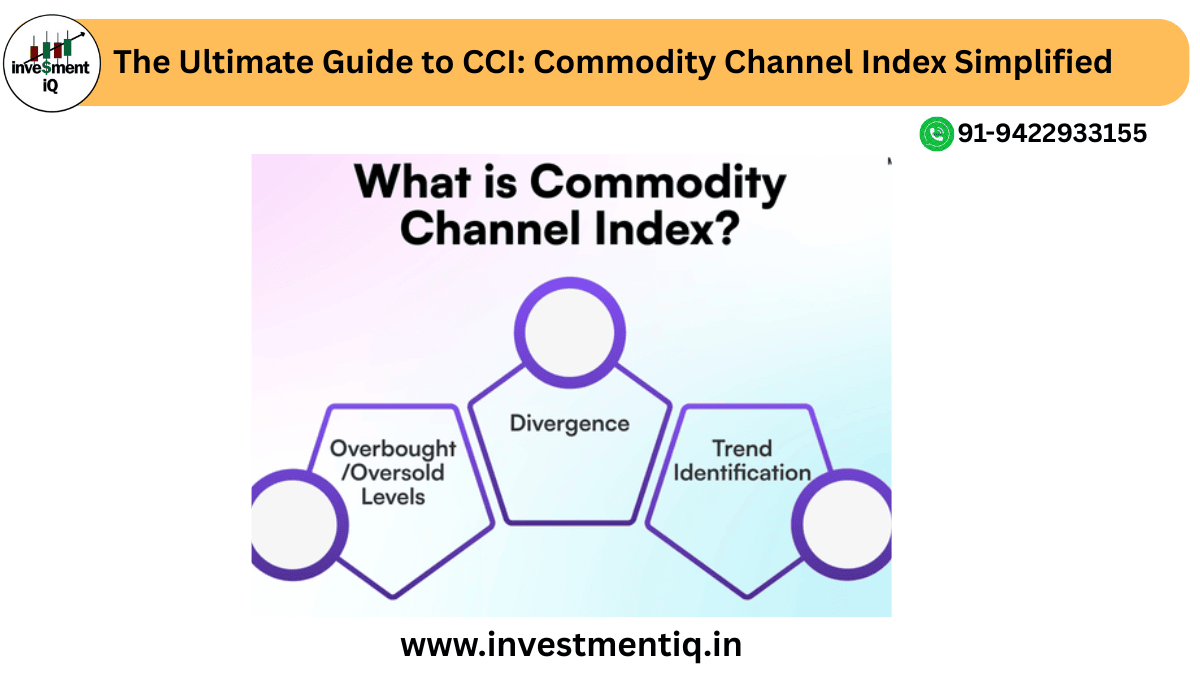
📘 What Is the Commodity Channel Index (CCI)?
Developed by Donald Lambert in 1980, the CCI measures how far the current price has moved away from its statistical average. In simple terms, it helps you identify whether a market is trading at an extreme level compared to its recent history.
It’s plotted as a line that oscillates above and below a zero baseline, with key levels often set at +100 and -100.
- CCI > +100 → The market is overbought (potential reversal downward).
- CCI < -100 → The market is oversold (potential reversal upward).
However, when used correctly, these levels don’t just identify reversals — they also help confirm the strength of ongoing trends.
📊 How Is the CCI Calculated?
While you don’t need to memorize the math, understanding the logic behind it helps:
[
CCI = \frac{(Typical Price – SMA)}{0.015 \times Mean Deviation}
]
Where:
- Typical Price (TP) = (High + Low + Close) / 3
- SMA = Simple Moving Average of TP over a chosen period (commonly 20)
- 0.015 = Constant used to normalize values around ±100
The result is a value that reflects how far prices have deviated from their average — a snapshot of market momentum.
⚙️ How to Interpret CCI Signals
The CCI indicator can help traders in multiple ways — from spotting reversals to confirming strong trends.
✅ 1. Overbought and Oversold Levels
When CCI rises above +100, it suggests the market is entering an overbought zone prices might soon pull back.
When CCI drops below -100, it signals an oversold zone — prices could rebound soon.
However, instead of reacting immediately, experienced traders wait for confirmation — for instance, when CCI moves back below +100 or above -100 after hitting these extremes.
✅ 2. Trend Confirmation
During strong bullish trends, the CCI can remain above +100 for extended periods — showing strong buying momentum.
In bearish trends, it can stay below -100 for a while — indicating sustained selling pressure.
✅ 3. Divergence Signals
- Bullish Divergence: Price makes lower lows, but CCI forms higher lows → potential trend reversal upward.
- Bearish Divergence: Price makes higher highs, but CCI forms lower highs → potential reversal downward.
💡 Practical Example
Imagine you’re analyzing Infosys Ltd. stock:
- Over the past few sessions, the CCI climbs to +180 — indicating overbought conditions.
- You notice the price struggling to break resistance, and CCI soon dips back below +100.
This could signal a short-term correction, helping you book profits early or plan a short trade.
On the other hand, when the CCI dips to -150 and then starts rising above -100, it can indicate renewed buying interest — a possible early entry point before the next uptrend.
🔍 Best CCI Settings for Different Traders
| Trading Style | Recommended CCI Period | Purpose |
| Day Trading | 9–14 periods | Captures quick intraday momentum |
| Swing Trading | 20 periods (default) | Ideal for short-to-medium-term reversals |
| Position Trading | 50 periods | Filters short-term noise, focuses on trends |
The shorter the period, the more sensitive the CCI becomes — generating more frequent signals but also more false alarms.
🧠 How to Use CCI with Other Indicators
To reduce false signals and improve accuracy, combine CCI with trend confirmation tools such as:
- Moving Averages (MA):
- If CCI crosses above +100 and the price is above the 50-day MA → strong buy confirmation.
- If CCI drops below -100 and the price is below MA → strong sell signal.
- If CCI crosses above +100 and the price is above the 50-day MA → strong buy confirmation.
- RSI (Relative Strength Index):
- RSI below 30 and CCI below -100 → oversold confirmation.
- RSI above 70 and CCI above +100 → overbought confirmation.
- RSI below 30 and CCI below -100 → oversold confirmation.
- MACD (Moving Average Convergence Divergence):
- Use MACD crossovers to confirm CCI momentum signals.
- Use MACD crossovers to confirm CCI momentum signals.
Combining indicators provides multiple confirmations, helping traders filter out noise in volatile conditions.
⚠️ Common Mistakes to Avoid
- Reacting Too Early:
Don’t sell just because CCI hits +100 or buy immediately at -100. Wait for confirmation or supporting signals. - Ignoring Trend Context:
Overbought readings during strong uptrends don’t always mean a reversal — they can indicate strength. - Using Short Timeframes Alone:
Always check higher timeframes (like daily or weekly charts) for confirmation before acting on intraday CCI signals. - Overloading Indicators:
CCI works best when paired with 1–2 complementary tools, not a cluttered dashboard.
🌍 Real-World Applications of CCI
Professional traders use CCI not just for commodities, but across:
- Equities: To identify momentum shifts in trending stocks like Reliance or HDFC Bank.
- Forex: To detect overbought/oversold levels during currency fluctuations.
- Indices: To forecast potential reversals in indices like Nifty 50 or Dow Jones.
Its flexibility and responsiveness make it a favorite for both manual traders and algorithmic systems.
🚀 Conclusion: Trade Smarter with CCI
The Commodity Channel Index might seem complex at first glance, but once you understand its rhythm, it becomes one of the most powerful tools in your trading arsenal.
It not only helps you identify entry and exit points, but also builds your confidence in reading market momentum.
Remember — trading isn’t just about signals; it’s about discipline, patience, and consistency. The CCI gives you the clarity to trade with confidence, especially when combined with other market tools.If you’re ready to learn advanced trading strategies and take your skills to the next level, explore our in-depth stock market and technical analysis courses at Investment IQ — your partner in mastering financial literacy and long-term
you may be interested in this blog here:
How To Calculate Market Share (Definition and Examples)
What Are the 11 Stock Market Sectors?