Read more about the article Swing Charting
"Swing Charting simplifies price action by highlighting significant highs and lows, helping traders identify trends and reversals."

Swing Charting

Swing Charting What do Point & Figure charts, Kagi charts, Renko charts, Filtered Waves, and ZigZag have in common? They are all related to swing charting in some way. What…

Continue ReadingSwing Charting
Read more about the article Arms Index (TRIN)
⚖️ Is buying or selling pressure dominating the market? The Arms Index (TRIN) helps traders spot market extremes and short-term reversals with volume-weighted accuracy. 🔍 A powerful tool for intraday and swing traders.

Arms Index (TRIN)

What Is the Arms Index (TRIN)? The Arms Index, also known as the TRIN or Short-Term TRading INdex, is a breadth indicator developed by Richard W. Arms in 1967. The…

Continue ReadingArms Index (TRIN)
Read more about the article Technical Indicators & Overlays
📈 Want to level up your chart analysis? Learn how to use indicators like RSI & MACD and overlays like moving averages to spot trends, momentum, and entry points. 🎯

Technical Indicators & Overlays

Technical Indicators & Overlays Introduction Technical Indicators are the often squiggly lines found above, below and on-top-of the price information on a technical chart. Indicators that use the same scale…

Continue ReadingTechnical Indicators & Overlays
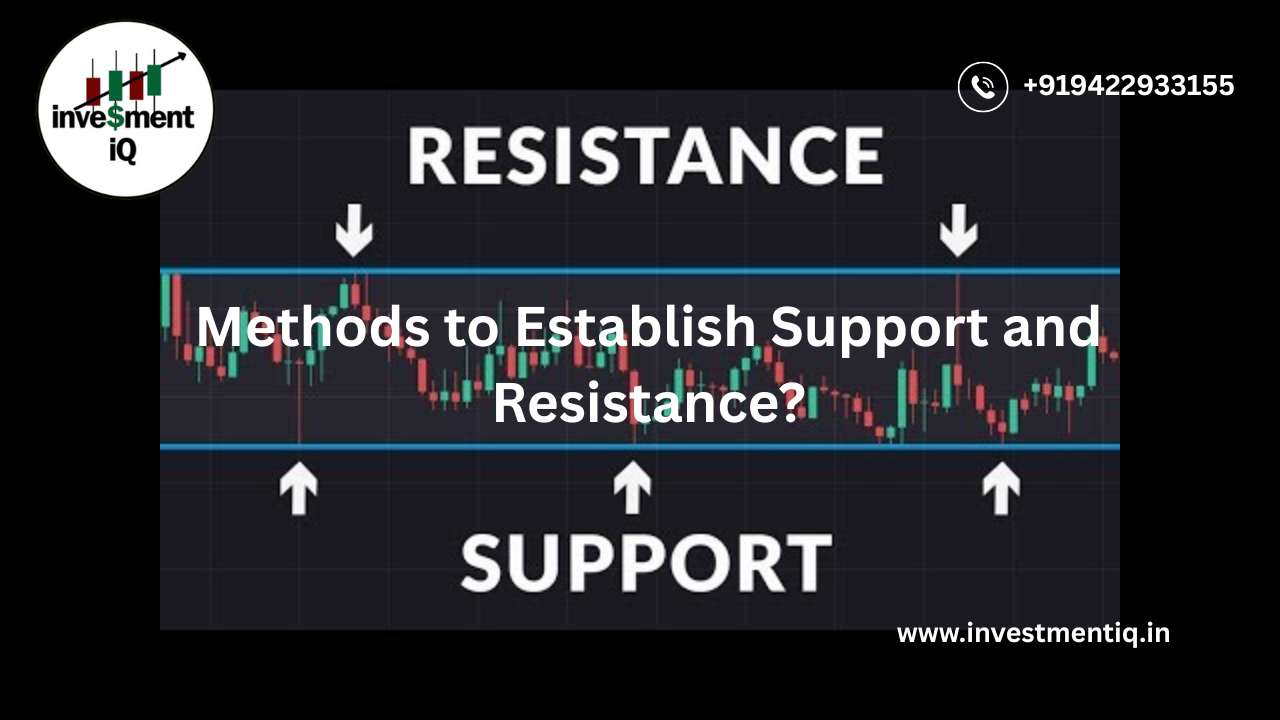
Read more about the article Methods to Establish Support and Resistance?
📊 Not all support & resistance levels are obvious! Learn proven methods — from trendlines to Fibonacci retracements — to identify key price zones with confidence. 🚀

Methods to Establish Support and Resistance?

Highs and Lows Support can be established with the previous reaction lows, while resistance can be established by using the previous reaction highs. The below chart of Halliburton (HAL) shows…

Continue ReadingMethods to Establish Support and Resistance?
Read more about the article Why and How To Use Correlation
🔗 Did you know some assets move together or opposite each other? That’s correlation — a powerful tool to manage risk and spot trading opportunities. 📊 Learn how to use it to your advantage!

Why and How To Use Correlation

What Is Correlation? In statistics, correlation measures the degree to which two (or more) variables move together. Positive correlation values indicate movement together in the same direction. Negative correlation values…

Continue ReadingWhy and How To Use Correlation