Read more about the article Methods to Establish Support and Resistance?
📊 Not all support & resistance levels are obvious! Learn proven methods — from trendlines to Fibonacci retracements — to identify key price zones with confidence. 🚀

Methods to Establish Support and Resistance?

Highs and Lows Support can be established with the previous reaction lows, while resistance can be established by using the previous reaction highs. The below chart of Halliburton (HAL) shows…

Continue ReadingMethods to Establish Support and Resistance?
Read more about the article Understanding Support & Resistance in Trading in-2025
📉📈 Price keeps bouncing at certain levels? That’s no coincidence — it's support and resistance at work! Learn how to spot these key zones and use them to plan better entries and exits. 🔍💡

Understanding Support & Resistance in Trading in-2025

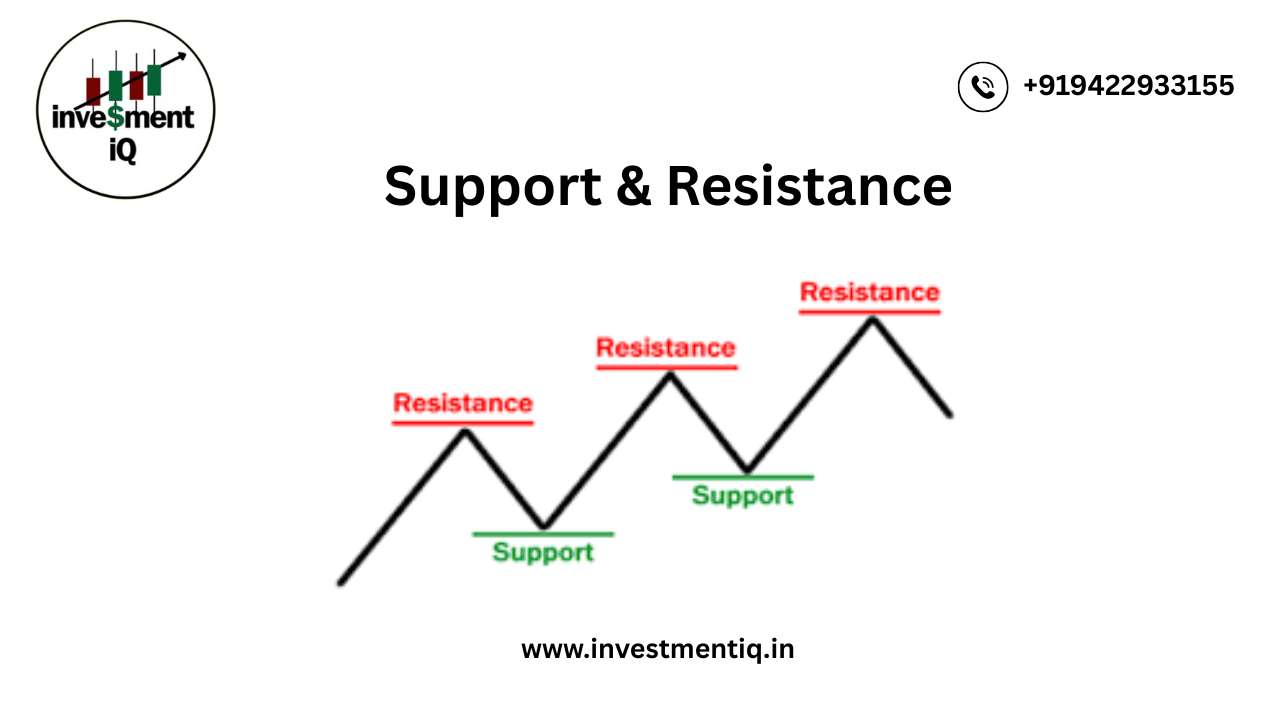
Support and Resistance—In Simple Words Key points where supply and demand collide are represented by levels of support and resistance. Excess supply (down) and demand (up) are what drive prices in the financial markets. Bears, selling, and supply are interchangeable. Bullish, bulls, and purchasing are all connected with demand. In this and other articles, these names are used interchangeably. Prices rise in response to rising demand and fall in response to rising supply. Prices fluctuate sideways as bulls and bears battle for power when supply and demand are equal. What Is Support? The price level at which demand is believed to be sufficiently strong to stop further price declines is known as support. According to the rationale, buyers are more likely to purchase and sellers are less likely to sell when the price drops near support and becomes less expensive. Demand is expected to outpace supply by the time the price hits the support level, keeping it from dropping below it. Example of support levels on the chart of Amazon.com, Inc. (AMZN) However, support is not always reliable, and a break below it indicates that the bears have defeated the bulls.…

Continue ReadingUnderstanding Support & Resistance in Trading in-2025
Read more about the article Why and How To Use Correlation
🔗 Did you know some assets move together or opposite each other? That’s correlation — a powerful tool to manage risk and spot trading opportunities. 📊 Learn how to use it to your advantage!

Why and How To Use Correlation

What Is Correlation? In statistics, correlation measures the degree to which two (or more) variables move together. Positive correlation values indicate movement together in the same direction. Negative correlation values…

Continue ReadingWhy and How To Use Correlation
Read more about the article How Are Charts Formed?
📈 Ever wondered how those charts actually form? From price movement to candlestick patterns — every chart tells a story. 🔍 Learn how market data transforms into visual insights!

How Are Charts Formed?

How Are Charts Formed? There are different chart types. We will focus on the four most popular charting methods—line, bar, candlestick, and point & figure charts. Line Chart The closing level is more significant to certain traders and investors than the open, high, or low.You can disregard intraday fluctuations by  concentrating solely on the closing.…

Continue ReadingHow Are Charts Formed?
Read more about the article How to Pick a Timeframein-2025
⏱️ Struggling to choose the right trading timeframe? Whether you're a day trader, swing trader, or long-term investor — your success starts with the right chart! 📊

How to Pick a Timeframein-2025

How to Pick a Timeframe The timeframe for creating a chart depends on the compression of the data—intraday, daily, weekly, monthly, quarterly, or annual. The less compressed the data, the…

Continue ReadingHow to Pick a Timeframein-2025