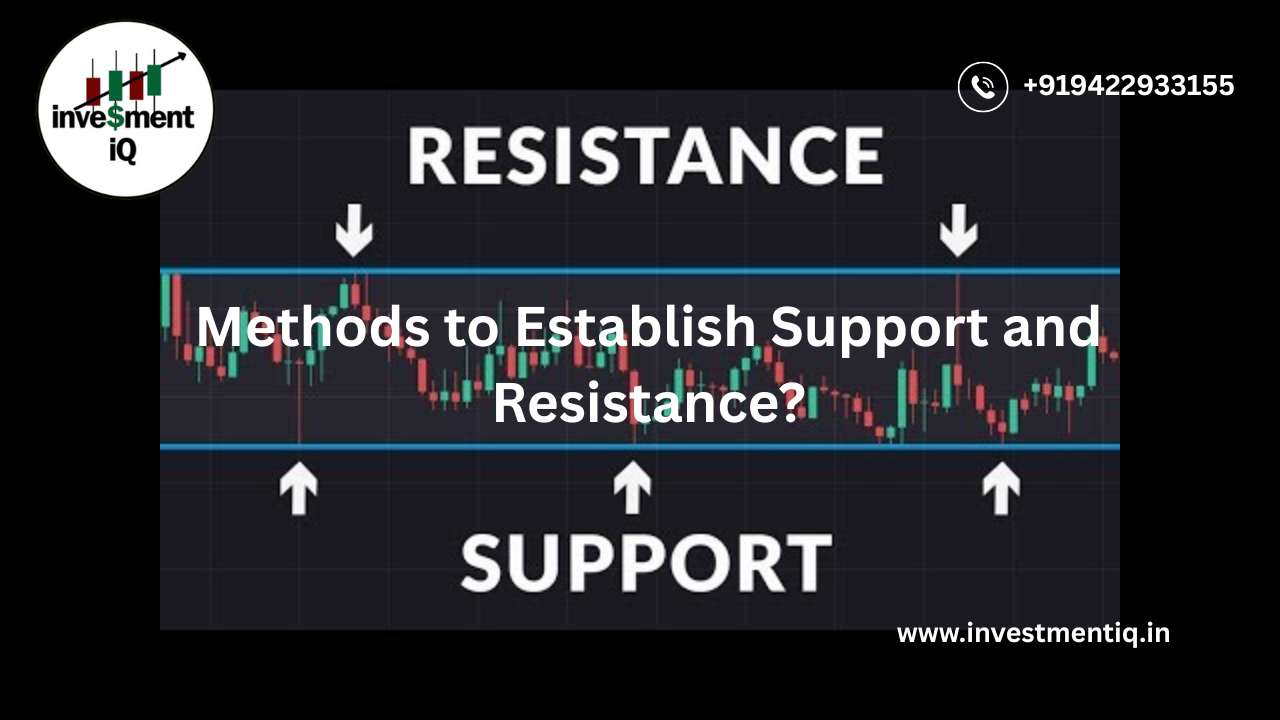
Methods to Establish Support and Resistance?
Highs and Lows Support can be established with the previous reaction lows, while resistance can be established by using the previous reaction highs. The below chart of Halliburton (HAL) shows…
What Is Correlation? In statistics, correlation measures the degree to which two (or more) variables move together. Positive correlation values indicate movement together in the same direction. Negative correlation values…
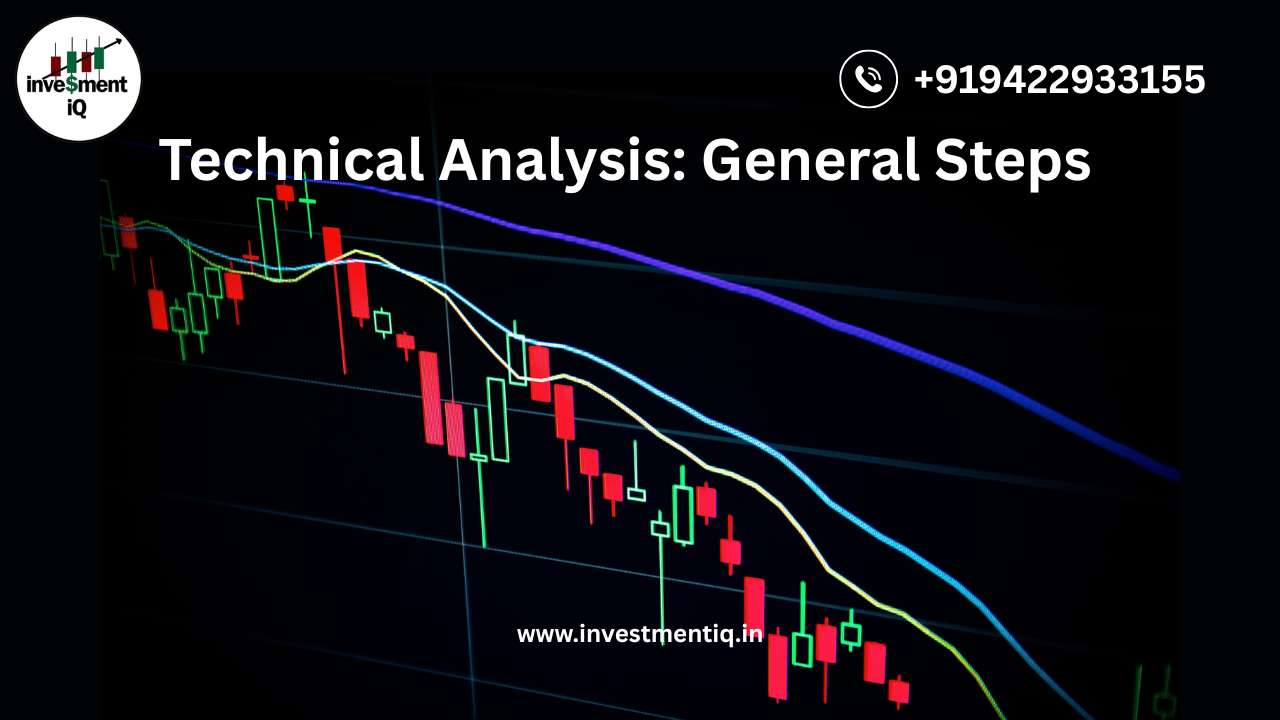
Technical Analysis: General Steps Many technicians apply a top-down approach that begins with broad-based market analysis, then narrows down to specific sectors/industries, and ultimately analyzes individual stocks. Welcome to Part…
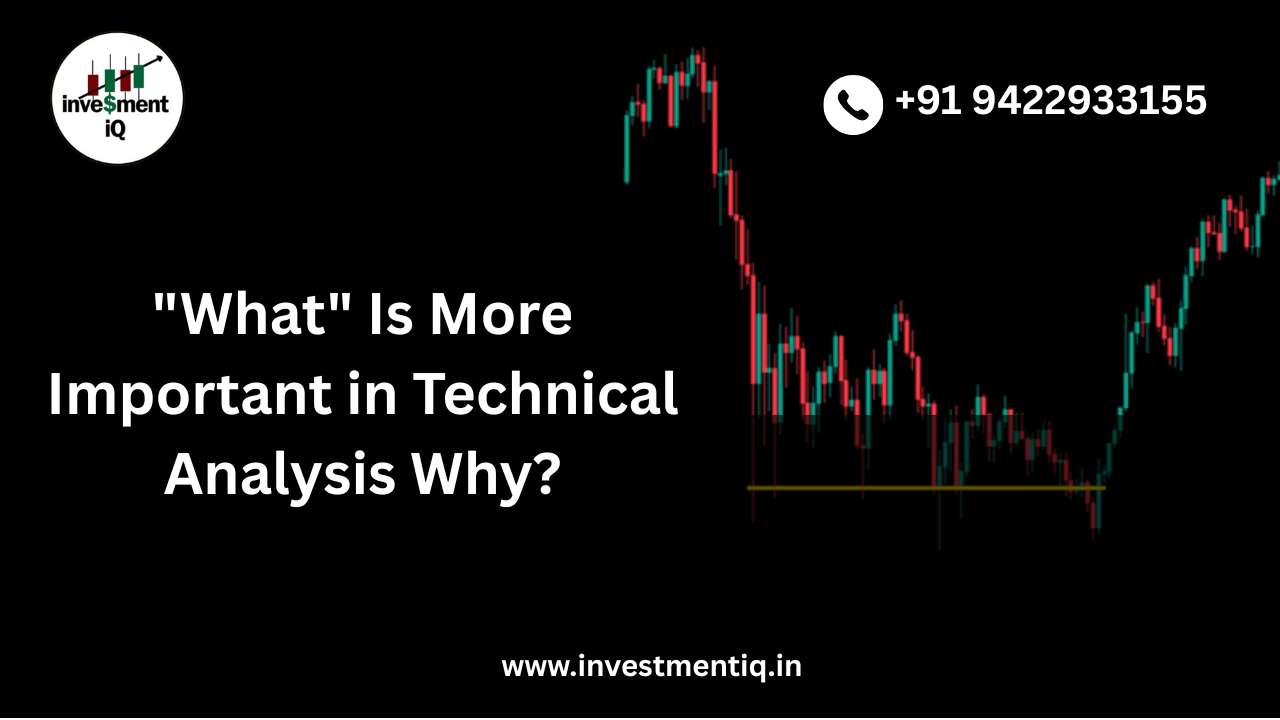
"What" Is More Important inTechnical Analysis Than "Why" What is the current price? What is the history of the price movement? The price of a security is the end result…
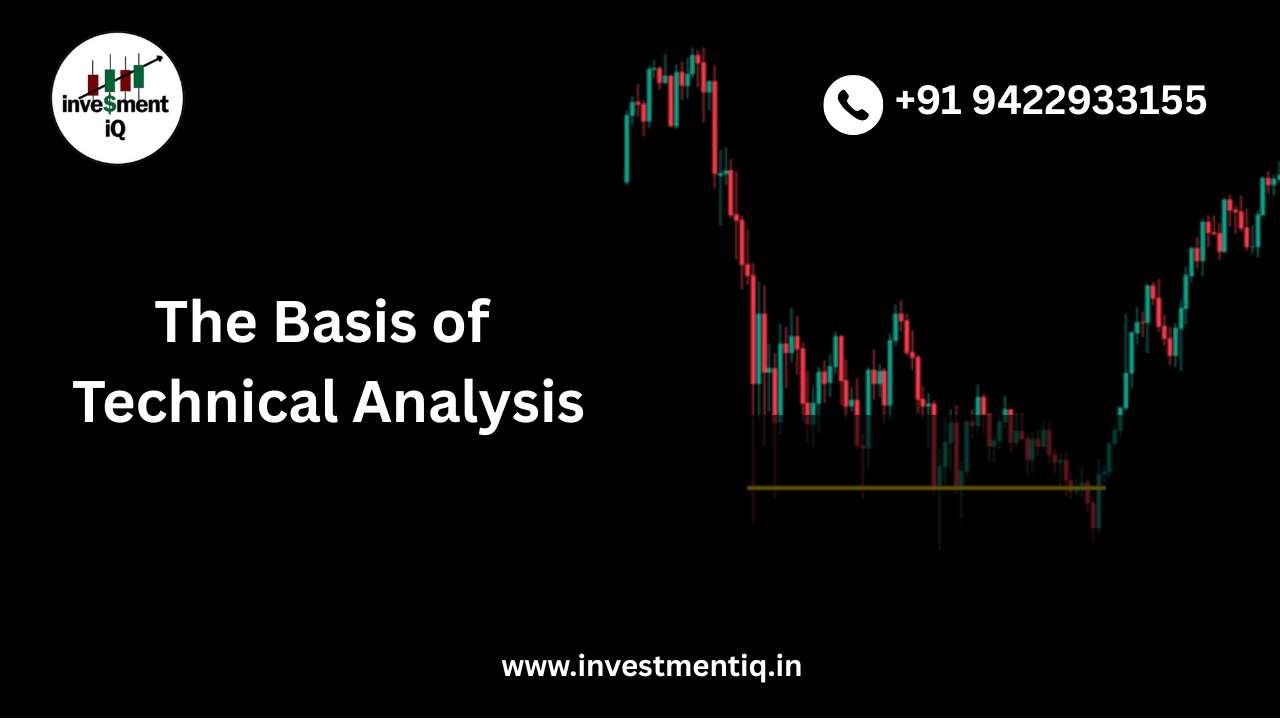
At the turn of the century, the Dow Theory laid the foundations for what would later become modern technical analysis. Dow Theory wasn't presented as one complete amalgamation but rather…
Dominate the Markets with Smart Technical Analysis | TA 101 – Part 17 Smart Technical Analysis Comparison Charting Welcome to Part our Technical Analysis 101 Series – "Dominate the Markets…
Dominate the Markets with Smart Technical Analysis | TA 101 – Part 16 Smart Technical Analysis of Candlestick Patterns A trader can gain insight into the current market psychology and…
Dominate the Markets with Smart Technical Analysis TA 101 – Part 15 Markets with Smart Technical Analysis Gaps Price charts often have blank spaces known as gaps. They represent times…
Dominate the Markets with Smart Technical Analysis | TA 101 – Part 14 Dominate the Markets with Smart Technical Analysis Fibonacci Lines Welcome to Part our Technical Analysis 101 Series…
Decision v Point Swenlin Trading Oscillator (STO) Short-term tops and bottoms can be identified with the help of an overbought/oversold indicator. Decision Point Intermediate. Click here to see that in Details The Swenlin Trading Oscillator (STO), an overbought/oversold indicator created by Carl Swenlin, can help spot short-term tops and bottoms. There are two variations: STO-B, which uses advances and declines, and STO-V, which uses advancing and declining volume. It is only proper to compute on an index because the computation is dependent on the number of advancers and decliners. Calculating STO The daily advances less decreases divided by the total number of daily advances and declines times 1000 is the STO, which is a 5-day simple moving average of a 4-day exponential moving average: (A-D)/(A+D)*1000. The width version of the STO can be computed using advances and declines, as demonstrated in the example below. Just replace advances and declines with advancing and declining volume to compute the volume version.A copy STO: 5 SMA (4…