
Dominate the Markets with Smart Technical Analysis-TA 101 – Part 9
Price Channels Trending prices frequently form a channel in which parallel trend lines can limit prices above and below. When trend channels form, it is helpful to draw the top…


Dominate the Markets with Smart Technical Analysis-TA 101 – Part-8 Technical Analysis of Trend Psychology The psychology of market players' greed and fear ultimately dictates how prices move in a…
Random Walk vs. Non-Random Walk Introduction The famous argument between random and non-random walkers is still going strong. These theories are best illustrated by two competing books. Burton Malkiel's 1973 book A Random Walk Down Wall Street is now considered a classic in the field of investment literature. Princeton economist Malkiel contends that investors cannot beat the main indices because price fluctuations are mostly random. Random Walk vs Non-Random Walk The counterargument is presented in the 2001 book A Non-Random Walk Down Wall Street, which was aptly titled by Andrew W. Lo and A. Craig MacKinlay. MacKinlay, a professor of finance at Wharton, and Lo, a professor of finance at MIT, contend that there are predictable components and that price swings are not entirely random. Now let's get the fight started! wanty to learn about technical Analysis in brief Random Walk Theory With…
Chart Analysis - Support and Resistance Technical Analysis Fear and greed, two of humanity's most powerful emotions, influence prices. A stock drops when more investors are afraid it will! Until…
Last part- Dominate the Markets with Smart Technical AnalysisTA 101 – Part 5 Chart Scaling Technical Analysis There are two types of vertical pricing scales that can be used to…
Technical analysis in stocks TA 101 – Part 5 Many traders find candlestick charts to be more aesthetically pleasing and simpler to understand than typical OHLC bar charts. Every candlestick…
Line Charts Plotting a line between the closing prices for each of the chart's periods yields a line chart. A line connecting the daily closing prices is displayed on a…
The Value of Technical Analysis The reason technical analysis has value is that directional price moves are often sustained for a period of time, allowing analysts to detect and profit…
Defining Technical Analysis The study of price and volume fluctuations over time is known as technical analysis. Financial charts are typically used in technical analysis to assist in the understanding…
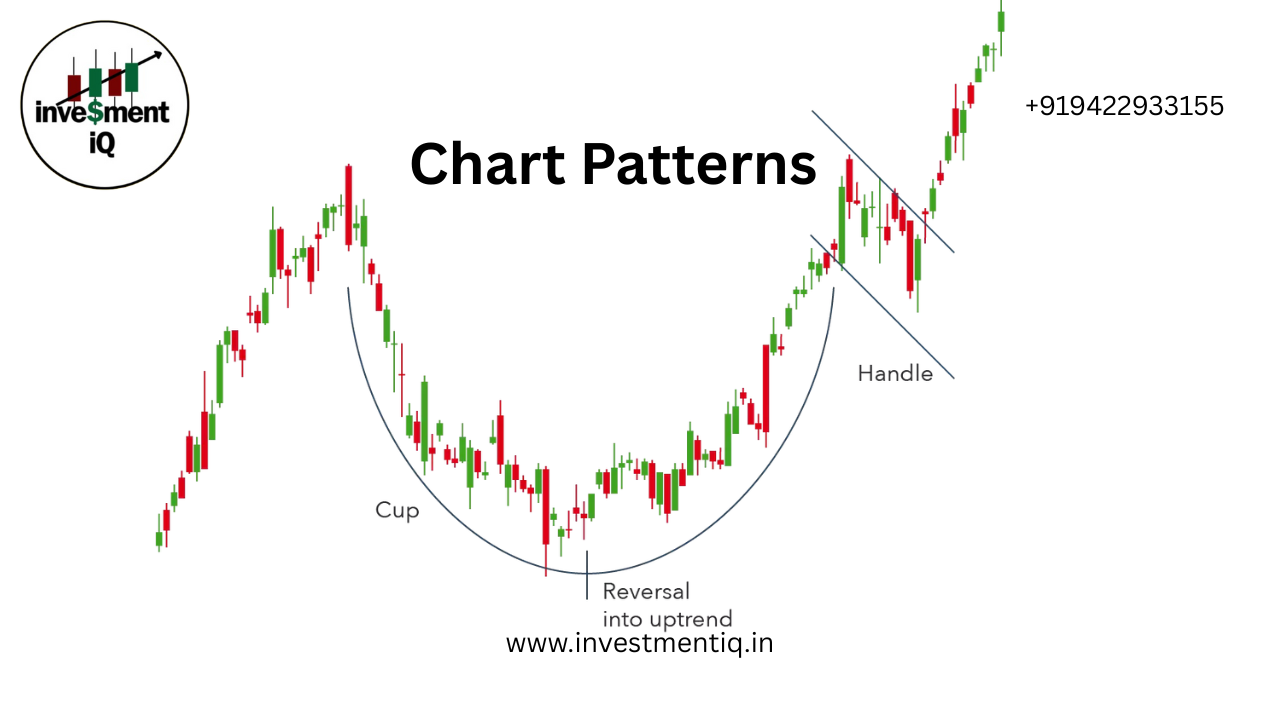
Why Are Chart Patterns Important? The forces of supply and demand drive prices in the financial market. Who is winning—the sellers or the buyers? In order to determine whether a market is heading upward, downward, or sideways, chart patterns offer a visual depiction of the conflict between buyers and sellers. You can make better buying and selling judgments if you are aware of this. Numerous chart designs are available. The majority fall into one of two general categories: continuation patterns or reversal patterns. While continuation patterns suggest the price trend will continue following a brief consolidation, reversal patterns indicate a change in the trend. In the StockCharts platform, you can scan for various chart patterns in the Predefined Scans available in the…