What Is a Stock Market Index?
Key Points Stock market indexes track sectors and sizes, offering a view of economic conditions. Various index types suit different investor goals, from total market to specific segments. Index funds…

Key Points Stock market indexes track sectors and sizes, offering a view of economic conditions. Various index types suit different investor goals, from total market to specific segments. Index funds…

What is a stock? You must have heard the term stocks quite frequently. They are a form of financial securities that represents a part-ownership in a company. Stocks let you…

High-Low Percent A breadth indicator that measures the percentage of net new highs within a particular group, such as a SPDR or index ETF. What Is the High-Low Percent? A breadth indicator that calculates the proportion of net new highs is the High-Low Percent.…

Understand the stock market with this comprehensive guide on why analyzing securities is essential for any investor. Dive into the different analysis techniques and make informed investment decisions. Analysis Security…

Retirement may seem far off for some, but the earlier you start planning and managing your retirement fund, the better prepared you’ll be when the time comes. Whether you're just…

In the world of technical analysis, traders rely on indicators to predict market movements and identify profitable entry and exit points. Among the most popular momentum indicators are the Relative…
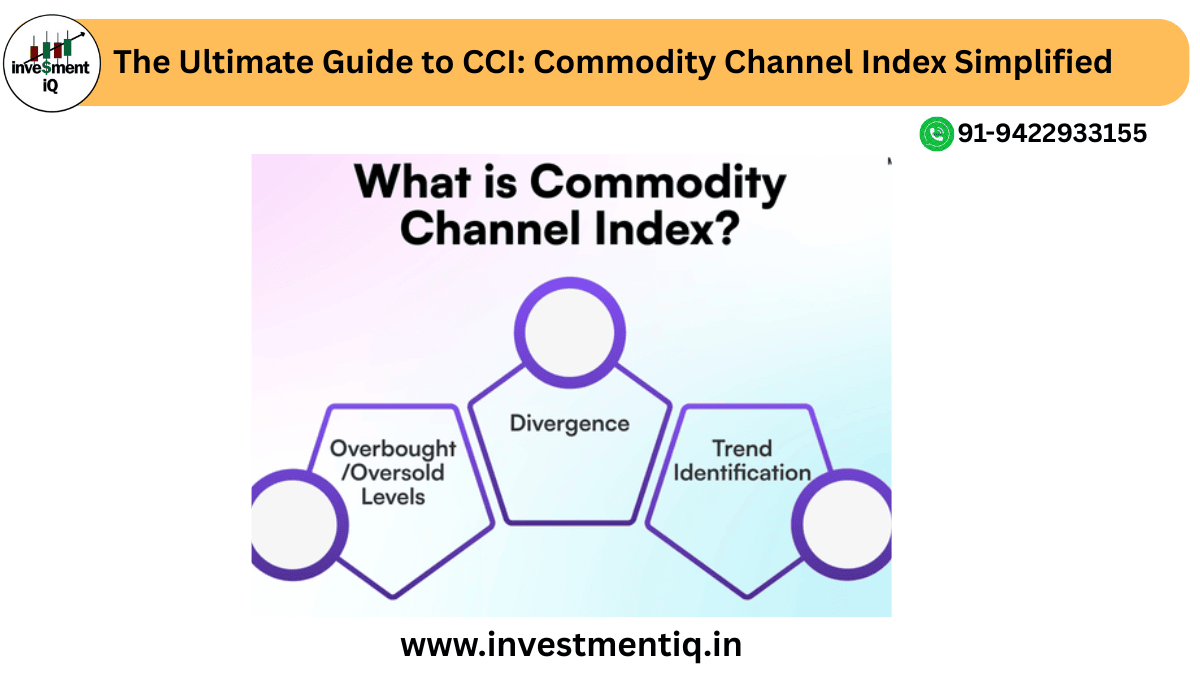
When it comes to understanding market momentum, traders often turn to indicators like RSI or MACD. But there’s one hidden gem that deserves more attention the Commodity Channel Index (CCI).…
The Value of Technical Analysis The reason technical analysis has value is that directional price moves are often sustained for a period of time, allowing analysts to detect and profit…

In today’s unpredictable financial markets, traders face one consistent challenge — volatility. Prices swing rapidly, emotions run high, and decision-making becomes harder than ever. During such chaos, having the right…
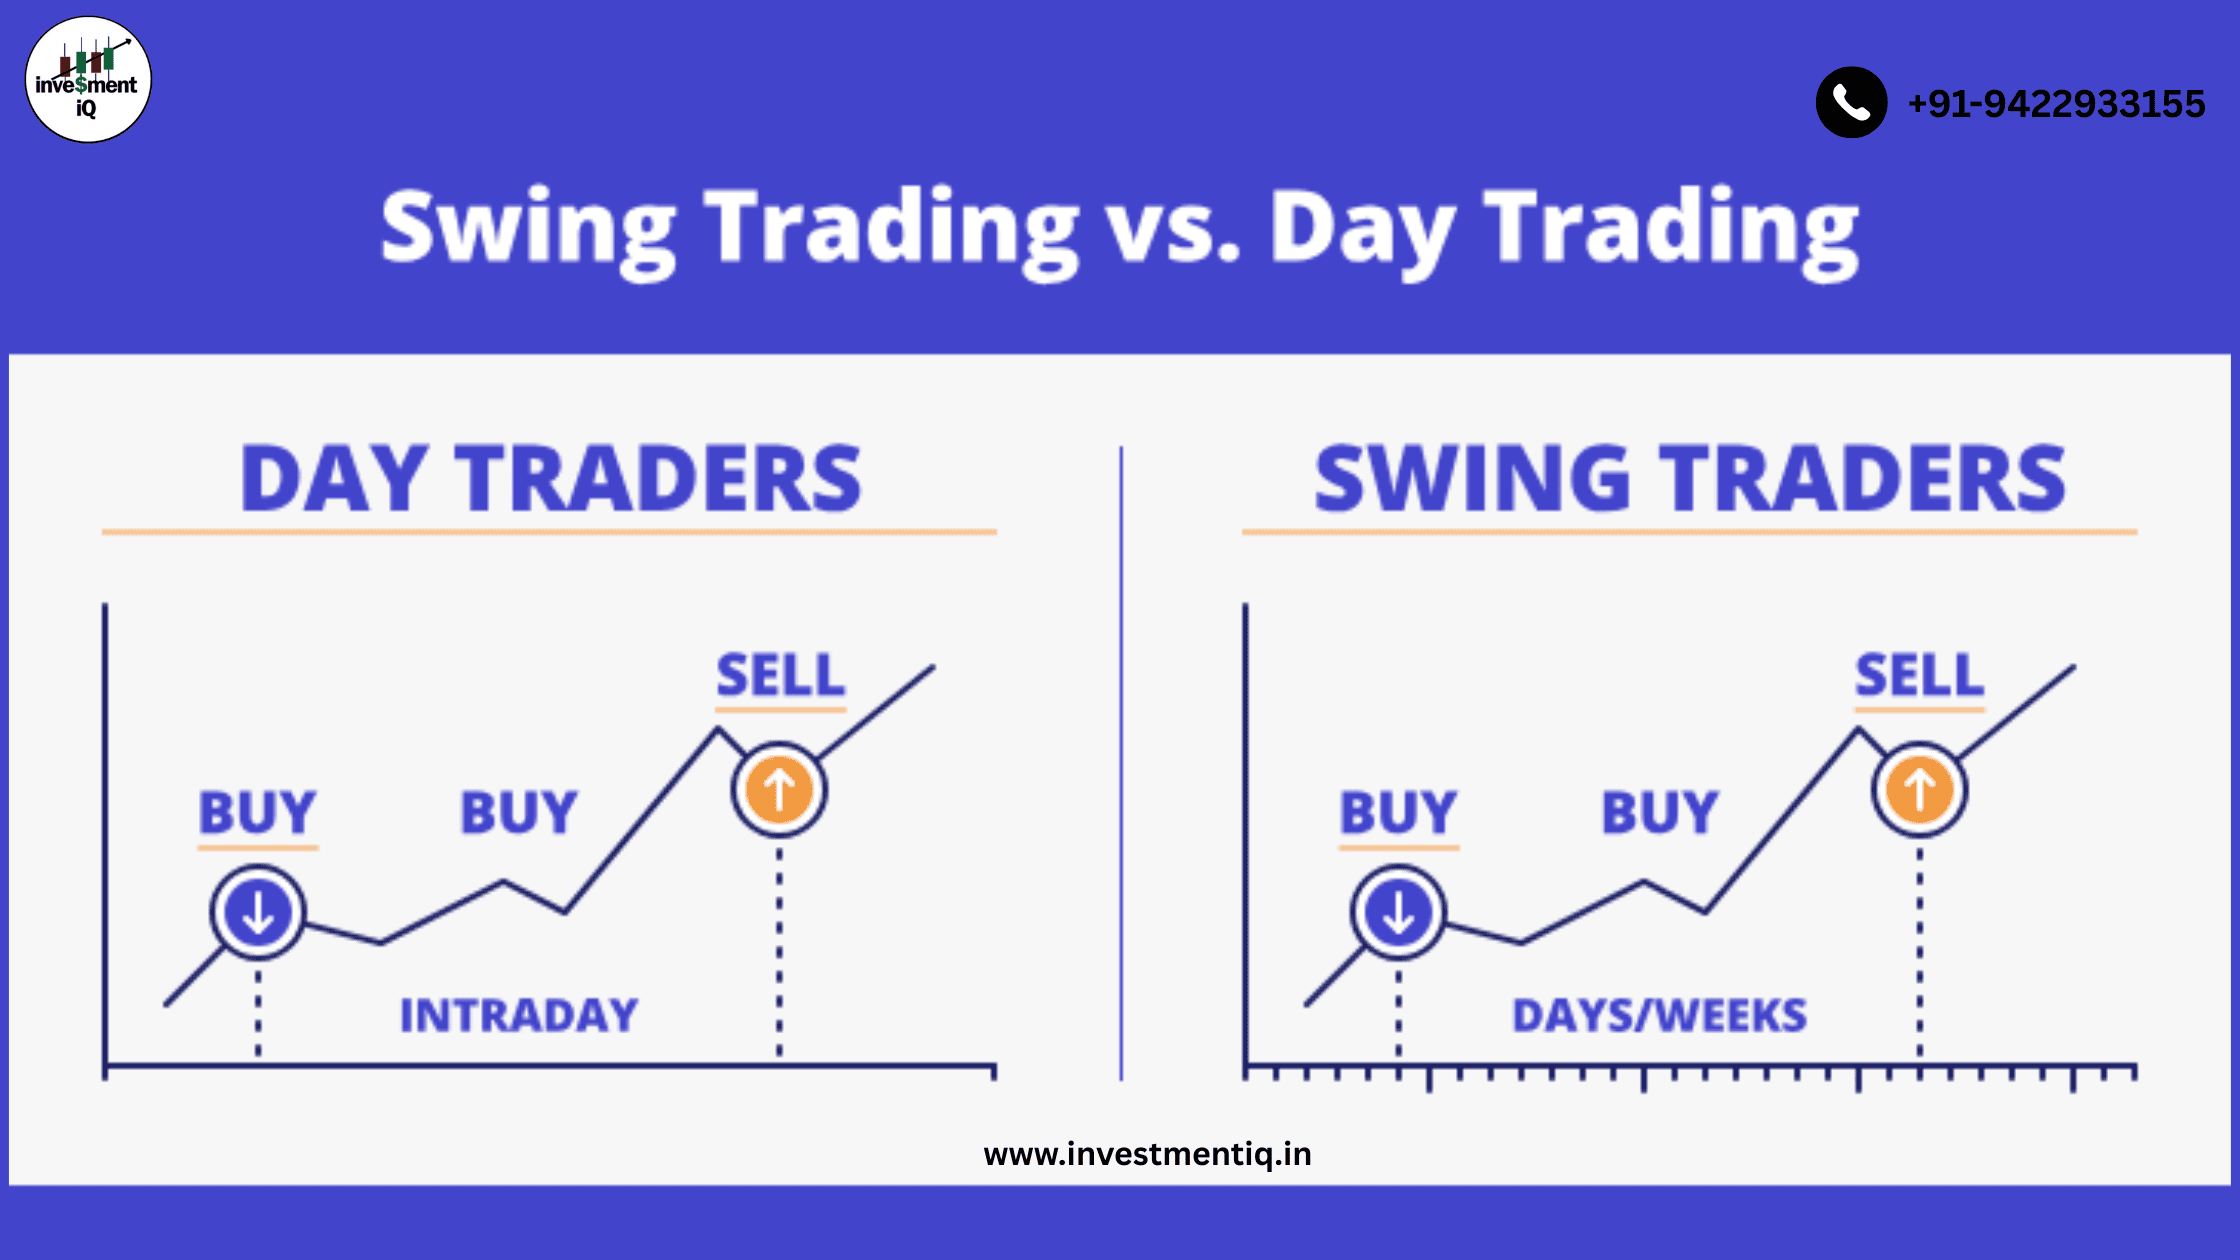
Swing vs. Day Trading Swing Trading vs. Day Trading: Which One Is Right for You? Introduction Both strategies are exciting. They help traders profit from market moves. But they suit…