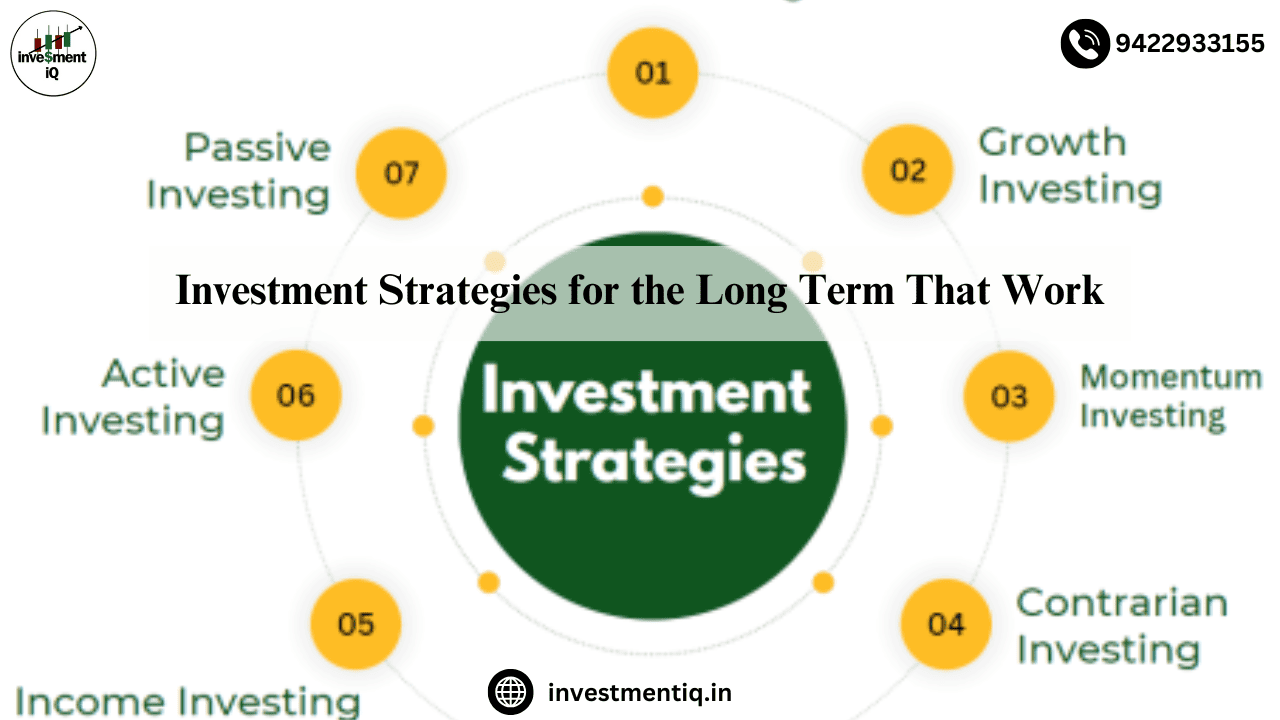
Investment Strategies for the Long Term That Work
Long-term investing is still the best way to beat the market, and these tips and strategies will help to put you on a path to success. Key Points Buy-and-hold investing…

Long-term investing is still the best way to beat the market, and these tips and strategies will help to put you on a path to success. Key Points Buy-and-hold investing…
A technical indicator provides an alternative viewpoint for examining the price movement. Some, like moving averages, have comparatively simple physics and are derived from basic mathematics. Others, like stochastics, have intricate formulas that take more research to completely comprehend and value. Technical indicators can offer a distinct viewpoint on the direction and strength of the underlying price action, regardless of how complicated the calculation is. An indicator known as a simple moving average determines the average price of a securities over a predetermined number of time periods. The data will be smoothed by a moving average if a security is very volatile. By eliminating random noise, a moving average provides a more consistent view of the price activity. Given how volatile Veritas (VRTSE) is, an analyst might find it challenging to identify a trend. Random fluctuations are smoothed down to make it simpler to spot a trend by applying a 10-day simple moving average to the price movement. Why Use Indicators? Indicators serve three broad functions: to alert, to confirm and to predict. An indicator can act as…
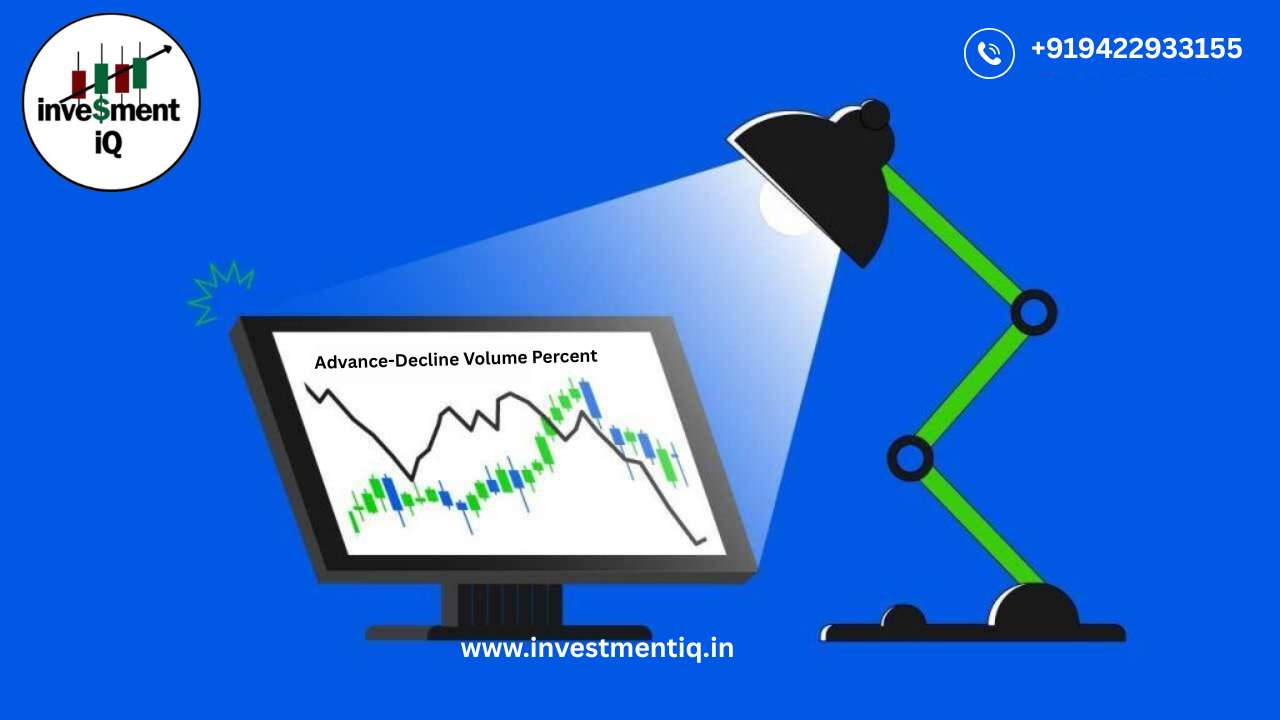
Advance-Decline Volume Percent A breadth indicator that measures the percentage of net advancing within a particular group, such as a SPDR or index ETF. you want to learn more about…
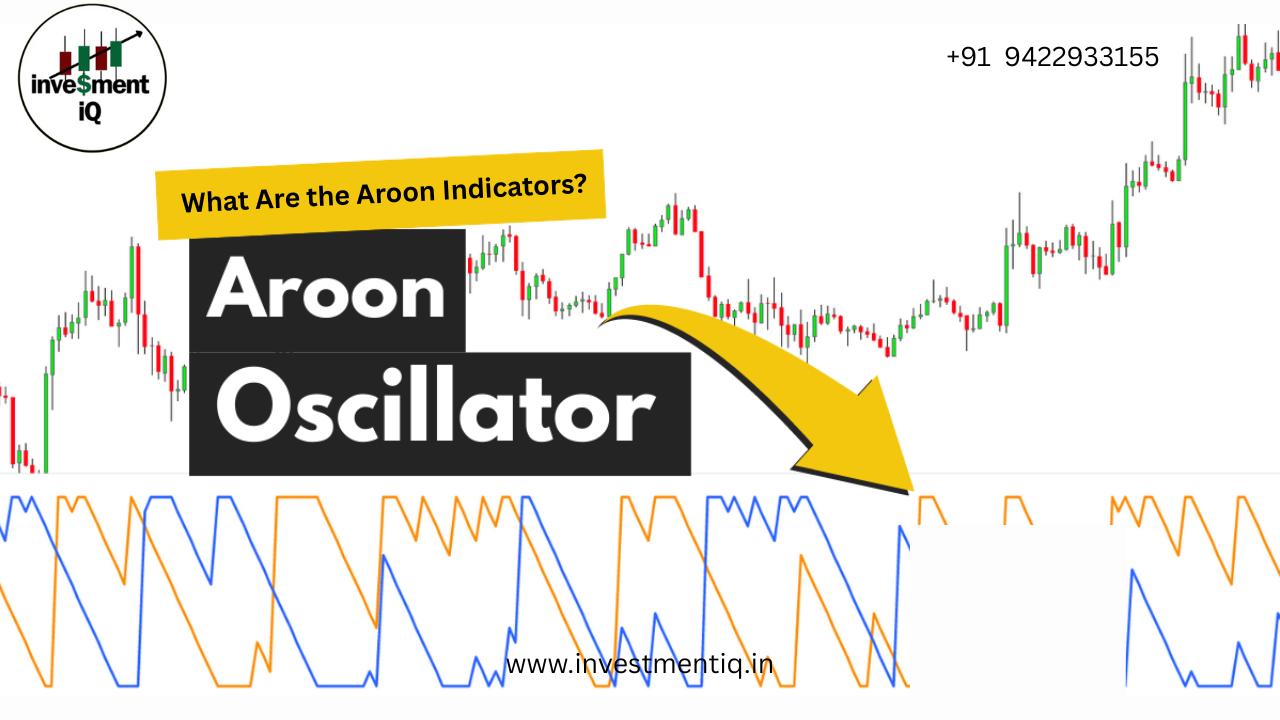
What Are the Aroon Indicators? Developed by Tushar Chande in 1995, Aroon is an indicator system that determines whether a stock is trending or not and how strong the trend…
Advance-Decline Line The Advance-Decline Line (AD Line) is a breadth indicator based on Net Advances. What Is the Advance-Decline Line? The Advance-Decline Line (AD Line) is a breadth indicator based…

The Pre-Holiday Effect There have been nine holidays in the last century when the Exchanges have customarily closed. Historical research shows that stock prices often behave in a specific manner in each of the two trading days preceding these holidays. By becoming aware of…
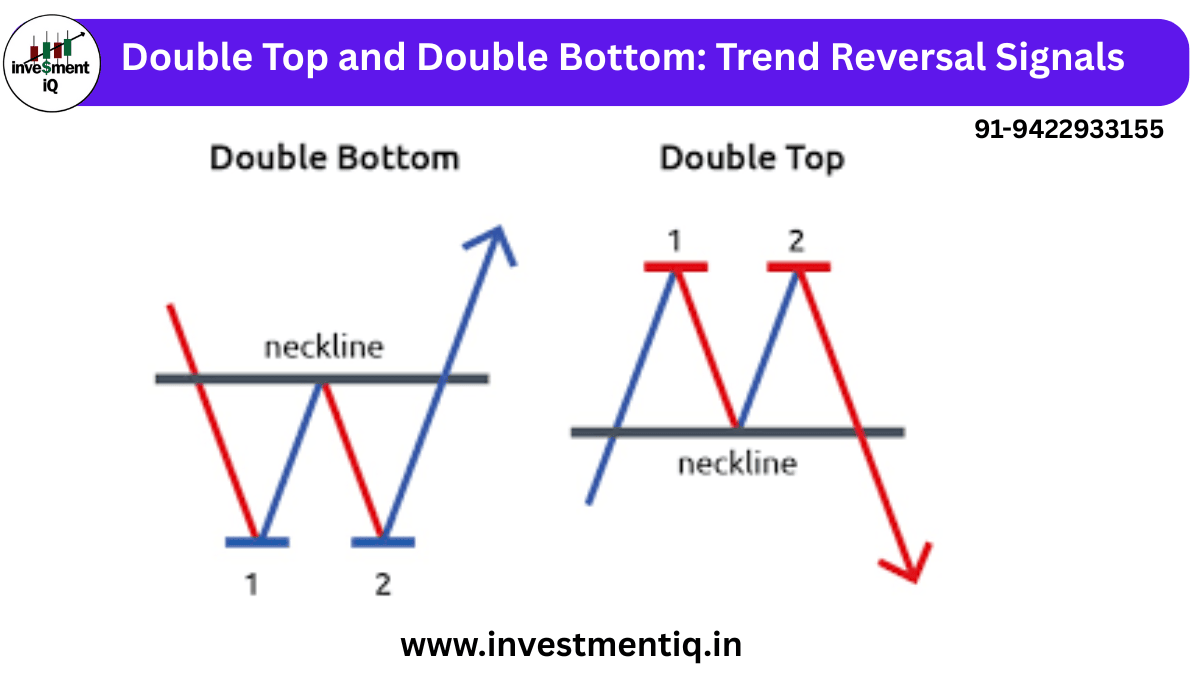
In the world of trading and investing, market patterns often tell us stories — stories of fear, greed, and opportunity. Among these timeless chart formations, Double Top and Double Bottom…
Introduction Which way is the market moving? How far up or down will it go? And when will it go the other way? These are the basic concerns of the…
Using Market Mood Index to predict Nifty returns in the 3 months following the Extreme Fear zone. The purpose of MMI is to assist investors in better timing their investments and trades. It is a sentiment indicator that gauges the state of the market right now. The indicator uses a scale of 0 to 100 to indicate the mood of the market. Focusing on zones—buying in high extreme fear (values below 20) and selling in high extreme greed (values above 80)—rather than worrying about the precise value of the MMI is the approach. All of the information regarding MMI and the various feeling zones is available here. This post's goal is to evaluate MMI's ability to forecast market returns in the three months that follow the extreme fear zone. Test Identify the dates when MMI entered extreme…

Introduction With climate change and sustainability dominating global conversations, investors are shifting toward more responsible choices. Green investing—also known as sustainable or ESG investing—is no longer just a trend. It…