Diffusion Indicators
A family of breadth oscillators for different securities collections, such as currencies, commodities, and key indexes.
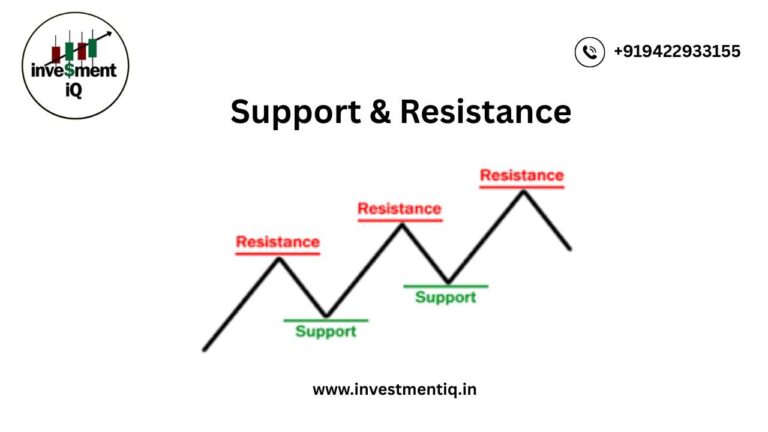
Finding out how many securities in a basket are responding favorably is the goal. The more of those there are, the more overbought the situation is and the more likely it is that the current trend will soon turn around. On the other hand, a bullish factor is a small number of securities in a favorable trend.
- The Dow Diffusion Indicator
- The Emerging Markets Diffusion Indicator
- The European Diffusion Indicator
- The Global Diffusion Indicator
- The Dollar (Currency) Diffusion Indicator
In general, a Diffusion Indicator is calculated by taking a basket of stocks/ETFs that are related in a particular way and counting the number of those stocks that are currently trading above their 40-day simple moving average. .
Generally speaking, reversals of these indicators from extreme readings will offer valid signals. Nevertheless, as with any indicator, there are times when they fail. Fortunately, this is mostly limited to two situations. First, contra-trend signals rarely work; in other words, buy signals in bear markets and sell signals in bull markets. Second, contra-trend signals that develop at the beginning of a primary trend, whether up or down, usually experience unusually strong momentum and are even more likely to fail or result in a very truncated corrective move.
The Dow Diffusion Indicator
The Dow Diffusion Indicator monitors how many of the 30 Dow stocks are above their 50-period SMA.W. On the chart below, the solid arrows show that, for the most part, reversals from beyond the overbought/oversold areas work reasonably effectively. The dashed arrows, by contrast, indicate the failures.

The action in the gray ellipse warns us that, in rare situations, the indicator will leave us in doubt, giving us all the more reason to consider other evidence and not rely on just one or two indicators. Additionally, the two confirmed divergences show that this series can also be used to point up sub-surface strength or weakness. To be effective, such divergences should be confirmed by some kind of trend reversal in the price, which, in these two cases, was signaled by trend line violations.
Note that the chart compares this series to the S&P Composite, as it seems to work just as well with this average as the DJIA itself.
The European Diffusion Indicator
The DIFEUR indicator calculates a basket of European ETFs that are above their 40-period MA. The data have been smoothed to isolate excessive jaggedness.

Overbought and oversold lines have been placed at +10 and -10. Reversals that take place from a position beyond those points are flagged by the green and red arrows. Note that a good rally can still take place even if the indicator doesn’t fall to an oversold level, as can be seen from the blue arrows.
The Emerging Market Diffusion Indicator
The !PRDIFEM indicator is calculated in the same way as the European Diffusion indicator, but in this case, Emerging Market ETFs are substituted.

It is interpreted in the same way, but due to the volatility of this sector, some of the buy and sell signals develop after most of the price move has taken place.
The Global Diffusion Indicator
The Global Diffusion indicator monitors a basket of country ETFs that are above their 40-period SMA’s. Since the resulting plot would be quite jagged, the !PRDIFGLO indicator contains an additional smoothing. Generally speaking, it is best interpreted by using reversals in excess of the overbought and oversold lines. In the case of daily data, these are plotted at +12.5 and -12.5, as you can see from the chart below. The dashed green buy signal in July of 2011 “worked” for a short period, but it was really a failure. That was because it was a contra-trend signal, since the 25% drop between the spring and fall of 2011 qualified as a mini-bear market.

The Dollar (Currency) Diffusion Indicator
The Dollar Index ($USD) is heavily weighted by the Euro (over 50%), which means that it occasionally offers a distorted picture of the currency’s fortunes. This is done by monitoring a basket of cross currency rates that are above their 40-day MAs. Currencies used include:
- the Australian Dollar
- the Japanese Yen
- the British Pound
- the Canadian Dollar
- the Mexican Peso
- the Indian Rupee and several others
Since the resultant series is quite jagged, entering the symbol !PRDIFCUR into the StockCharts platform returns a smoothed average of the raw data, as shown below:

The Dollar Diffusion Indicator can be used in two principal ways. The chart above flags overbought and oversold reversals using +4.5 and -4.5 as the signaling benchmarks. The solid arrows indicate successful signals, while the dashed lines failed ones.
The next chart, on the other hand, shows that the indicator occasionally lends itself to trend line construction as well as bullish and bearish divergences. It’s by no means perfect, but does offer a useful addition for analyzing the technical position of the US Dollar Index.

–