Are you new to the world of investing or trading and feeling overwhelmed by all the charts, candles, and strange Japanese-sounding indicators? Don’t worry—you’re not alone.
If you’ve ever wished for a single tool that could help you spot market trends, gauge momentum, and identify entry and exit points all at once, meet your new best friend: the Ichimoku Cloud.
In this blog post, we’ll break down the Ichimoku Cloud into simple, relatable terms so you can start using it to make more confident trading decisions—whether you’re a personal investor or an employee learning market insights to support your business strategies.
✅ What is the Ichimoku Cloud?
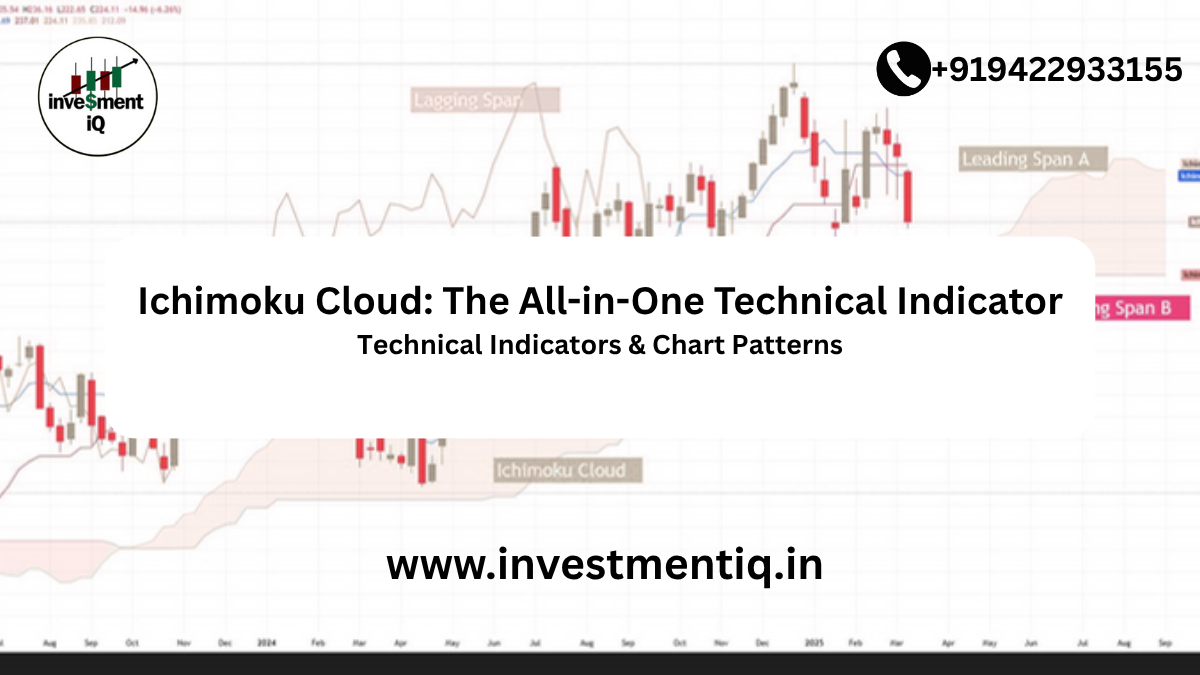
Developed in the 1960s by Japanese journalist Goichi Hosoda, the Ichimoku Cloud (officially known as Ichimoku Kinko Hyo, which means “one glance equilibrium chart”) is a comprehensive technical analysis tool that offers a snapshot of market conditions—trend direction, support/resistance levels, and momentum—all in one view.
In simple terms?
It’s like the Swiss Army knife of trading indicators. You get a complete weather report on the market with just one look.
🧠 Breaking Down the 5 Ichimoku Components
The Ichimoku Cloud consists of five main lines—each telling you something important about the market.
- Tenkan-sen (Conversion Line)
Short-term momentum
- Formula: (9-period high + 9-period low) / 2
- Think of it like a short-term speedometer.
- Formula: (9-period high + 9-period low) / 2
- Kijun-sen (Base Line)
Medium-term trend
- Formula: (26-period high + 26-period low) / 2
- A stronger signal than the Tenkan-sen, like a compass showing direction.
- Formula: (26-period high + 26-period low) / 2
- Senkou Span A (Leading Span A)
Part of the “cloud”
- Formula: (Tenkan-sen + Kijun-sen) / 2, plotted 26 periods ahead.
- Formula: (Tenkan-sen + Kijun-sen) / 2, plotted 26 periods ahead.
- Senkou Span B (Leading Span B)
- Formula: (52-period high + 52-period low) / 2, plotted 26 periods ahead.
- Formula: (52-period high + 52-period low) / 2, plotted 26 periods ahead.
- Chikou Span (Lagging Span)
Market sentiment
- The current closing price plotted 26 periods back.
- The current closing price plotted 26 periods back.
Together, Span A and Span B form the “cloud” (Kumo)—the shaded area on the chart that acts as dynamic support/resistance.
📊 What the Ichimoku Cloud Tells You
Imagine you’re driving through foggy weather. You want to know whether the road ahead is clear (trending), if there are obstacles (resistance), or if it’s safe to slow down or speed up. That’s exactly what Ichimoku helps you do in the financial markets.
Key Insights You Can Spot Instantly:
- Trend Direction: If price is above the cloud, it’s an uptrend. If it’s below the cloud, it’s a downtrend.
- Strength of the Trend: A thick cloud means strong support or resistance. A thin cloud signals possible reversals.
- Momentum Signals: When Tenkan-sen crosses Kijun-sen from below = bullish signal; from above = bearish signal.
- Future Forecasting: Since parts of the cloud are plotted ahead of current prices, Ichimoku gives a forward-looking perspective.
🏢 Real-World Application: Why Employees & Businesses Should Care
Understanding market trends isn’t just for full-time traders. Employees in roles like finance, marketing, or operations can benefit too:
- Finance professionals can assess market sentiment before quarterly reporting.
- Sales teams can use macro-trend knowledge to time product launches.
- Executives can make informed investment or hedging decisions.
For instance, if you work for a tech firm and the Ichimoku Cloud shows prolonged bearish trends in semiconductor stocks, it may be time to delay large-scale hardware investments or revisit pricing strategies.
💡 Beginner Tips to Start Using the Ichimoku Cloud
You don’t need to be a trading wizard to get started. Here are a few easy steps:
- Start with the daily chart to spot larger trends.
- Look for a clear cloud breakout: Price breaking above the cloud + bullish crossover = strong buy signal.
- Avoid trading in a flat or twisty cloud: It often signals indecision.
- Use Ichimoku with volume or RSI for more confident decisions.
- Practice on demo accounts before committing real money.
📈 Example Scenario
Let’s say you’re watching Apple stock (AAPL). The price recently broke above a green cloud and the Tenkan-sen crossed above the Kijun-sen. Volume is rising. These signals suggest bullish momentum—possibly a good time to enter the trade.
Now imagine this same skill helping you understand economic indicators, company performance, or even pitch market-related projects with more confidence. That’s financial literacy at work.
🚀 Take the First Step Toward Financial Mastery
The Ichimoku Cloud might seem complex at first glance, but once you break it down, it’s one of the most powerful tools available to traders and professionals alike.
Remember: mastery starts with momentum. Every professional investor, analyst, and CEO began as a beginner just like you. By learning tools like the Ichimoku Cloud, you’re not just learning to trade—you’re learning to see the market differently.
👉 Ready to Go Deeper?
Explore our [Advanced Ichimoku Cloud Trading Course] and dive into video lessons, real-time trading examples, and expert strategies that turn you from a beginner into a confident market navigator.
you may be interested in this blog here:-
What’s the difference between Treasury bonds, notes, and bills
Can I Open a Brokerage Account for My Child
What is the Contrast Between Favored Stock and Normal Stock?