What Is the Aroon Oscillator?
What Is the Aroon Oscillator? The Aroon Oscillator is the difference between Aroon-Up and Aroon-Down. These two indicators are usually plotted together for easy comparison, but chartists can also view…
The Aroon indicators fluctuate above/below a centerline (50) and are bound between 0 and 100. These three levels are important for interpretation. At its most basic, the bulls have the…
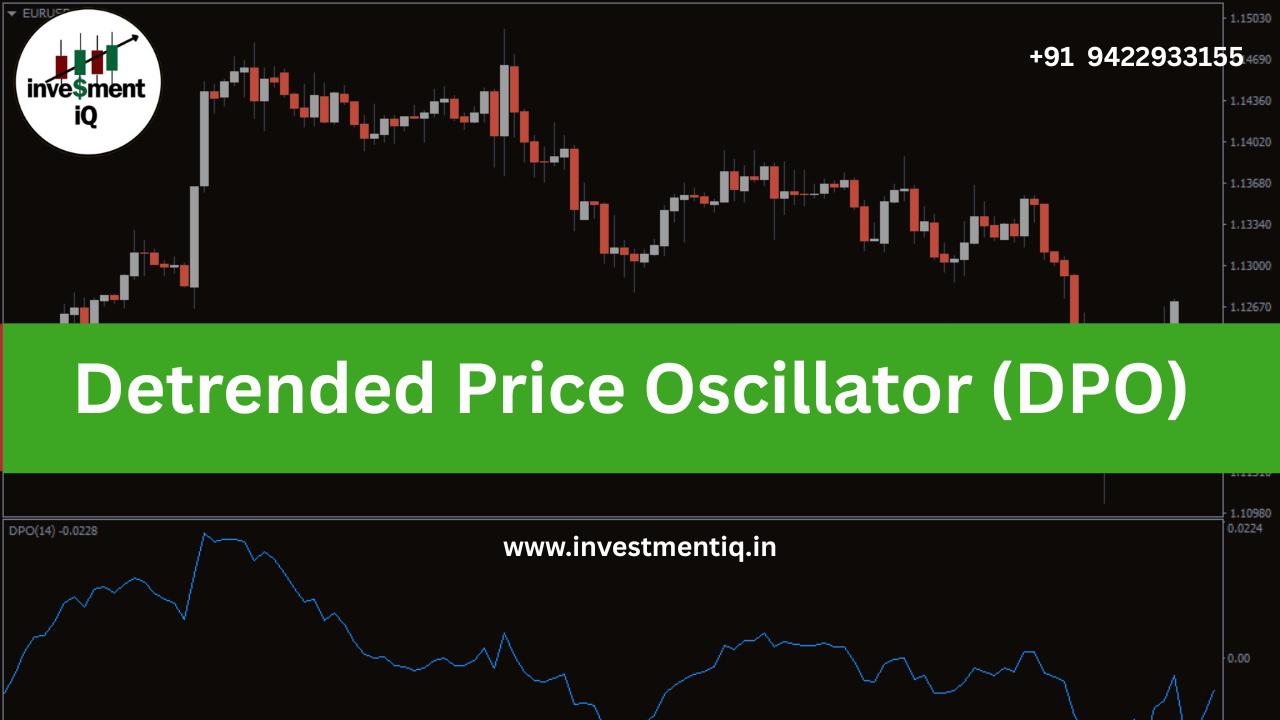
What Is the Detrend Price Oscillator (DPO)? An indicator called the Detrended Price Oscillator (DPO) was created to separate price trend and facilitate cycle identification. Since DPO is based on a displaced moving average, it does not extend to the latest date. However, since DPO is not a momentum oscillator, alignment with the most recent date is not a problem. Rather, cycle length is estimated and cycle highs and lows are identified using DPO. Calculation Copy Price {X/2 + 1} periods ago less the X-period simple moving average. X refers to the number…
PMO Configurations Sideways Wiggle A typical PMO formation is seen in the accompanying chart, which highlights the fact that not all PMO crossover signals may be interpreted literally. PMO movement during a consistent upward price trend is represented by the red-circled area. The PMO travels horizontally since the price movement is not very volatile. The fact that the PMO remains above the zero line testifies to the strength of the price move; however, minor zigzags in price…
DecisionPoint Price Momentum Oscillator (PMO) The DecisionPoint Price Momentum Oscillator (PMO), created by Carl Swenlin, is an oscillator that is based on a Rate of Change (ROC) calculation that has been twice smoothed using exponential moving averages and a specially designed smoothing procedure. The PMO can also be used as a relative strength tool because it is normalized. Stocks can thus be ranked by their PMO value as an expression of relative strength. Calculating the PMO A 1-period rate of change is smoothed using two bespoke smoothing methods to produce the DecisionPoint Price Momentum Oscillator. Although the custom smoothing algorithms are quite similar to Exponential Moving Averages, they just use the period by itself rather than adding one to the time period option to create the smoothing multiplier (as in a real EMA).A copy Smoothing Multiplier =…
Calculating the CMB Composite Index RSI Chg = 9-period ROC of 14-period RSI RSI Mom = 3-period SMA of 3-period RSI Composite Index Line = RSI Chg + RSI Mom…
What Is the CMB Composite Index? Constance Brown first presented the CMB Composite Index, an unbound momentum indicator, in her book Technical Analysis for the Trading Professional. The traditional RSI indicator, created by Welles Wilder, had several drawbacks that this updated version of RSI aims to address. First, Brown's signal now includes a momentum component, which Wilder's version does not. Brown also decided to turn the CMB Composite Index into an unbound indicator. Some reversal indications may be missed by traditional RSI because of its restricted character. Brown recommends looking for divergences between the CMB Composite Index and traditional RSI, which can indicate an upcoming reversal.…
What Is the Average True Range (ATR)? The Average True Range (ATR) is a volatility indicator that was created by J. Welles Wilder. Wilder created ATR with commodities and daily prices in mind, as he did with the most of his indicators. Compared to equities, commodities are sometimes more volatile. They frequently experience gaps and limit moves, which happen when a commodity opens up or closes below the session's maximum permitted change. The volatility of gap or limit moves would not be captured by a volatility model that solely relies on the high-low range. In order to account for this "missing" volatility, Wilder developed the Average True Range. It is important to remember that ATR doesn't indicate price direction, just volatility.In his 1978 book, New Concepts in Technical Trading Systems, Wilder discusses ATR. The Directional Movement Concept (ADX), RSI, and Parabolic SAR are also included in this book. Wilder's indications have endured and are still widely used even though they were created before the computer era. True…
Swing Charting What do Point & Figure charts, Kagi charts, Renko charts, Filtered Waves, and ZigZag have in common? They are all related to swing charting in some way. What…
Technical Indicators & Overlays Introduction Technical Indicators are the often squiggly lines found above, below and on-top-of the price information on a technical chart. Indicators that use the same scale…