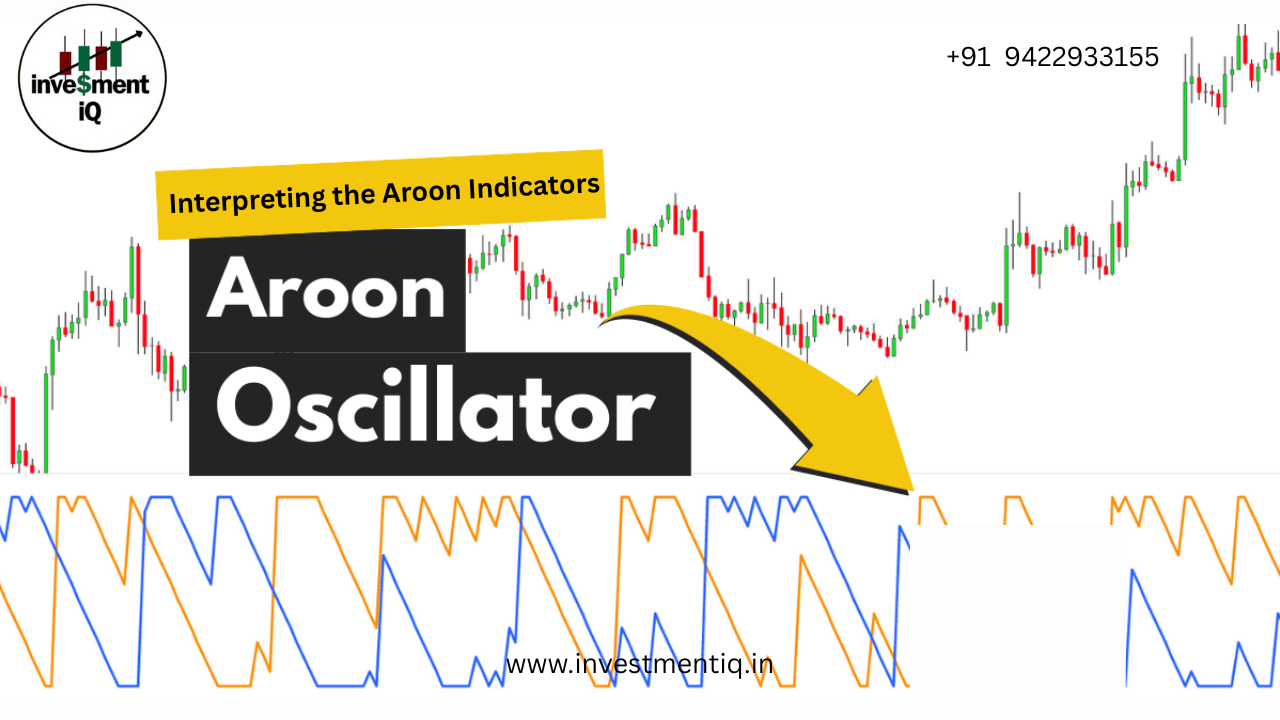
The Aroon indicators fluctuate above/below a centerline (50) and are bound between 0 and 100. These three levels are important for interpretation. At its most basic, the bulls have the edge when Aroon-Up is above 50 and Aroon-Down is below 50. This indicates a greater propensity for new x-day highs than lows. The converse is true for a downtrend. The bears have the edge when Aroon-Up is below 50 and Aroon-Down is above 50.
A surge to 100 indicates that a trend may be emerging. This can be confirmed with a decline in the other Aroon indicator. For example, a move to 100 in Aroon-Up combined with a decline below 30 in Aroon-Down shows upside strength. Consistently high readings mean prices are regularly hitting new highs or new lows for the specified period. Prices are moving consistently higher when Aroon-Up remains in the 70-100 range for an extended period. Conversely, consistently low readings indicate that prices are seldom hitting new highs or lows. Prices are NOT moving lower when Aroon-Down remains in the 0-30 range for an extended period. However, this does not mean that prices are moving higher. For that, we need to check Aroon-Up.
New Trend Emerging
There are three stages to an emerging trend signal. For an uptrend signal, the first stage occurs when Aroon-Up moves above Aroon-Down. This shows new highs becoming more recent than new lows. Keep in mind that Aroon measures the time elapsed, not the price. The second stage is when Aroon-Up moves above 50 and Aroon-Down moves below 50. The third stage is when Aroon-Up reaches 100 and Aroon-Down remains at relatively low levels. The first and second stages do not always occur in that order. Sometimes Aroon-Up will break above 50 and then above Aroon-Down. In a downtrend signal, the positions of the two lines are reversed: Aroon-Down breaks above Aroon-Up, breaks above 50, and reaches 100.

Aroon – Chart 2
The chart above shows CSX Corp (CSX) with weekly bars and 25-week Aroon. First, notice that the downtrend began weakening as Aroon-Down declined below 50 at the end of 2007 (far left). The first stage of an uptrend was signaled when Aroon-Up moved above Aroon-Down in early 2008 (first orange circle). Aroon-Up continued above 50 and hit 100 as Aroon-Down remained at relatively low levels. Notice how Aroon-Up remained near 100 as the advance continued. This emerging uptrend signal lasted until September 2008 when Aroon-Down broke above Aroon-Up, exceeded 50 and surged to 100 (second orange circle). Notice how Aroon-Down remained near 100 as the downtrend extended. The third trend on this chart was signaled when Aroon-Up surged to 100 in June 2009 and remained above 50 for over a year (third orange circle). Also, notice that Aroon-Down remained below 50 for over a year.
Consolidation Period
The Aroon indicators signal a consolidation when both are below 50 and/or both are moving lower with parallel lines. It makes sense that consistent readings below 50 are indicative of flat trading. For 25-day Aroon, readings below 50 mean a 25-day high or low has not been recorded in 13 or more days. Prices are clearly flat when not recording new highs or new lows. Similarly, a consolidation is usually forming when both Aroon-Up and Aroon-Down move lower in parallel fashion and the distance between the two lines is quite small. This narrow parallel decline indicates that some sort of trading range is forming. The first Aroon indicator to break above 50 and hit 100 will trigger the next signal.

Aroon – Chart 3
The chart above shows Omnicom (OMC) with the Aroon indicators moving below 50 in a parallel decline. The width of the channel could be narrower, but we can see the consolidation taking shape on the price chart for confirmation. Both Aroon-Up and Aroon-Down were below 50 in the yellow area. Aroon-Up then broke out and surged to 100, which was before the breakout. Further confirmation came with another Aroon-Up surge at the breakout point. This surge/breakout signaled the end of the consolidation and the beginning of the advance.

Aroon – Chart 4
The next chart shows Lifepoint Hospitals (LPNT) with 25-day Aroon. Both lines moved lower in May with a parallel decline. The distance between the lines was around 25 points throughout the decline. Aroon-Up and Aroon-Down flattened in June and both remained below 50 for around two weeks as the triangle consolidation extended. Aroon-Down (red) was the first to make its move, with a break above 50 just before the triangle break on the price chart. Aroon-Down hit 100 as prices broke triangle support to signal a continuation lower.
Aroon-Up and Aroon-Down are below 20
This simple scan searches for stocks where Aroon-Up and Aroon-Down are below 20. A consolidation is often present when both indicators are at such low levels. The first to break above 50 indicates the next directional clue.Copy
[type = stock] AND [country = US]
AND [Daily SMA(20,Daily Volume) > 100000]
AND [Daily SMA(60,Daily Close) > 20]

AND [Daily Aroon Up(25) < 20]
AND [Daily Aroon Down(25) < 20]
you may be interested in this blog here: