How to Invest in Stocks: A Beginner’s Guide
Do you want to get started with stock investing to build your wealth? Here's what you need to do Key Points Open a brokerage account to start buying stocks. Choose…
Key Points Common stock implies ownership in a firm with high growth potential but also risks complete loss. Preferred stock offers fixed dividends and prioritized asset claims, akin to bonds.…
When Genius Fails What attributes would you seek for when selecting someone to manage your investment funds? You want them to be trustworthy and knowledgeable, and you're more inclined to choose someone with a strong reputation for networking and intelligence. If you get three of these guys, say two Nobel Memorial Prize winners, you'll be willing to pay more for their 'expertise'. Investors in LTCM, a hedge fund created in 1994 by three geniuses, had high expectations for their investment. Unfortunately, these were not met. The fund failed and needed to be bailed out in 1998. Why IQ is Not Enough Humans are subject to many emotions - fear, greed, loss aversion, denial, external validation. So this…
After a stellar post Covid rebound, the Indian economy's growth is showing signs of sobering. The real GDP growth rate this quarter is down to 5.4%. This is much lower…
Here are 25 stocks to bet on in 2025! As we step into the year 2025, most market participants believe that India is likely to continue its growth momentum in…
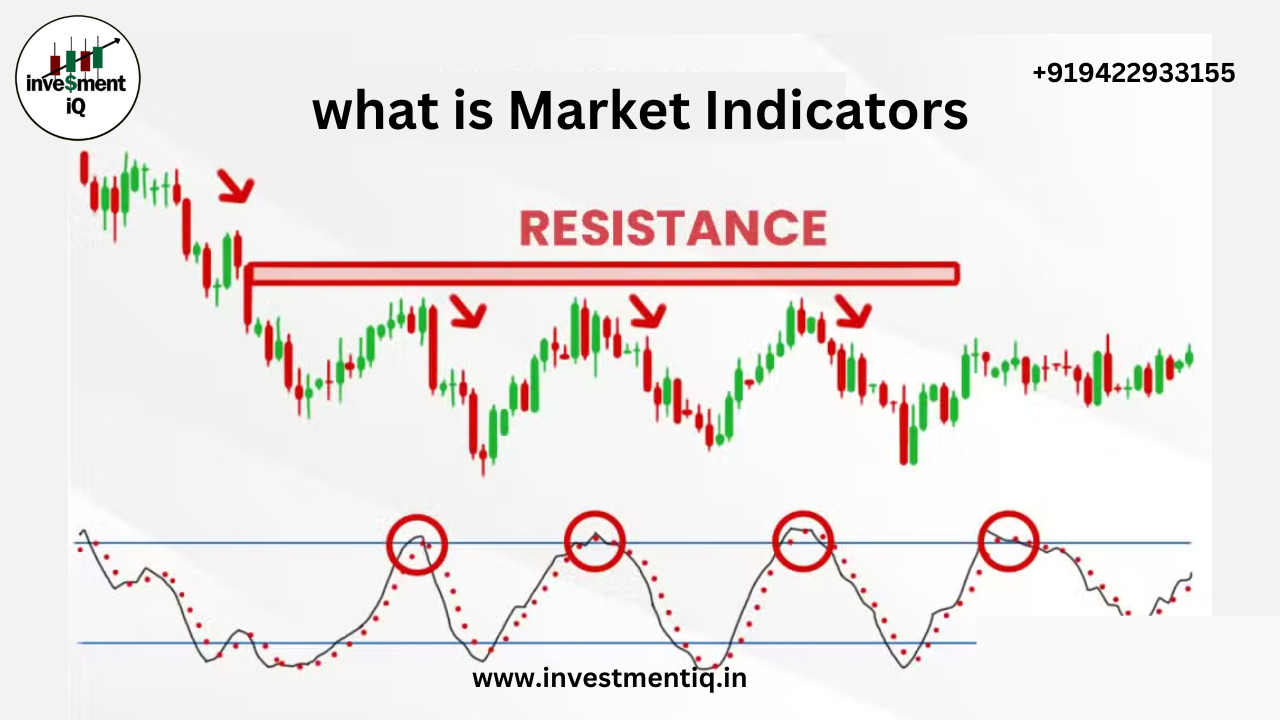
Leading indicators are intended to track price movements, as their name suggests. The majority show a type of price momentum over a predetermined lookback period, or the number of periods that are utilized to compute the indicator. For instance, the last 20 days of price activity, or roughly a month, would be used in the computation of a 20-day stochastic oscillator. All previous price movements would be disregarded. The Commodity Channel Index (CCI), Momentum, Relative Strength Index (RSI), Stochastic Oscillator, and Williams %R are a few of the more often used leading indicators. Momentum Oscillators Momentum oscillators are a common type of leading indicator. In general, momentum quantifies how quickly the price of an asset changes. Price momentum rises as a security's price does. The increase in momentum increases with the speed at which the security climbs (the larger the period-over-period price change). Momentum will slow as soon as this climb starts to slow. Momentum actually starts to drop from prior high levels when a security starts to trade flat. Declining momentum in the face of sideways trade, however, does not necessarily indicate a bear market. It merely indicates that momentum is gathering back to a level that is more median. Momentum indicators quantify price fluctuations using a variety of formulas. An metric of momentum called the relative strength index (RSI) analyzes the average price change during rising and falling periods. From October until the end of November, RSI increased on the IBM chart. The stock rose from the upper 60s to the low 80s throughout this time. The RSI experienced a significant decline (blue lines) during the first part of December while the stock was trading sideways. The stock's consolidation was healthy and rather typical. It would be anticipated that flat price movement would result in a drop in RSI (and momentum) from these high levels (around 70). If RSI were trading around 50…
The stock market is a fantastic invention of the modern world. The reason I say this is because both buying and selling is so easy if you have a large,…
Exchange-traded funds (ETFs) are a simple method to start investing. ETFs are quite simple to understand and can produce excellent returns with little expense or effort. Here's what you need…
When done well, investing in stocks is among the most effective ways to build long-term wealth. Here's a step-by-step guide to investing money in the stock market to help ensure you're…
Stock splits and share consolidations are common words in the stock trading world, but one that many investors may be confused by is the "1 for 5 share." This term often refers to a stock consolidation, a procedure in which a corporation reduces the number of existing shares while increasing the share price, preserving the entire value of an investor's holdings. In this article, we will look at what a one-for-five share consolidation is, how it works, and how it affects investors. What is a 1 for 5 Share? A 1 for 5 share consolidation means that for every five shares you now own, you will receive one in exchange. This is frequently done by businesses for a variety of reasons, and it is critical to understand how it affects both the company and investors. How Does It Work? Let's break down the process step by step: Before the consolidation: If you hold…