TA 101 – Part 4
Line Charts Plotting a line between the closing prices for each of the chart's periods yields a line chart. A line connecting the daily closing prices is displayed on a…
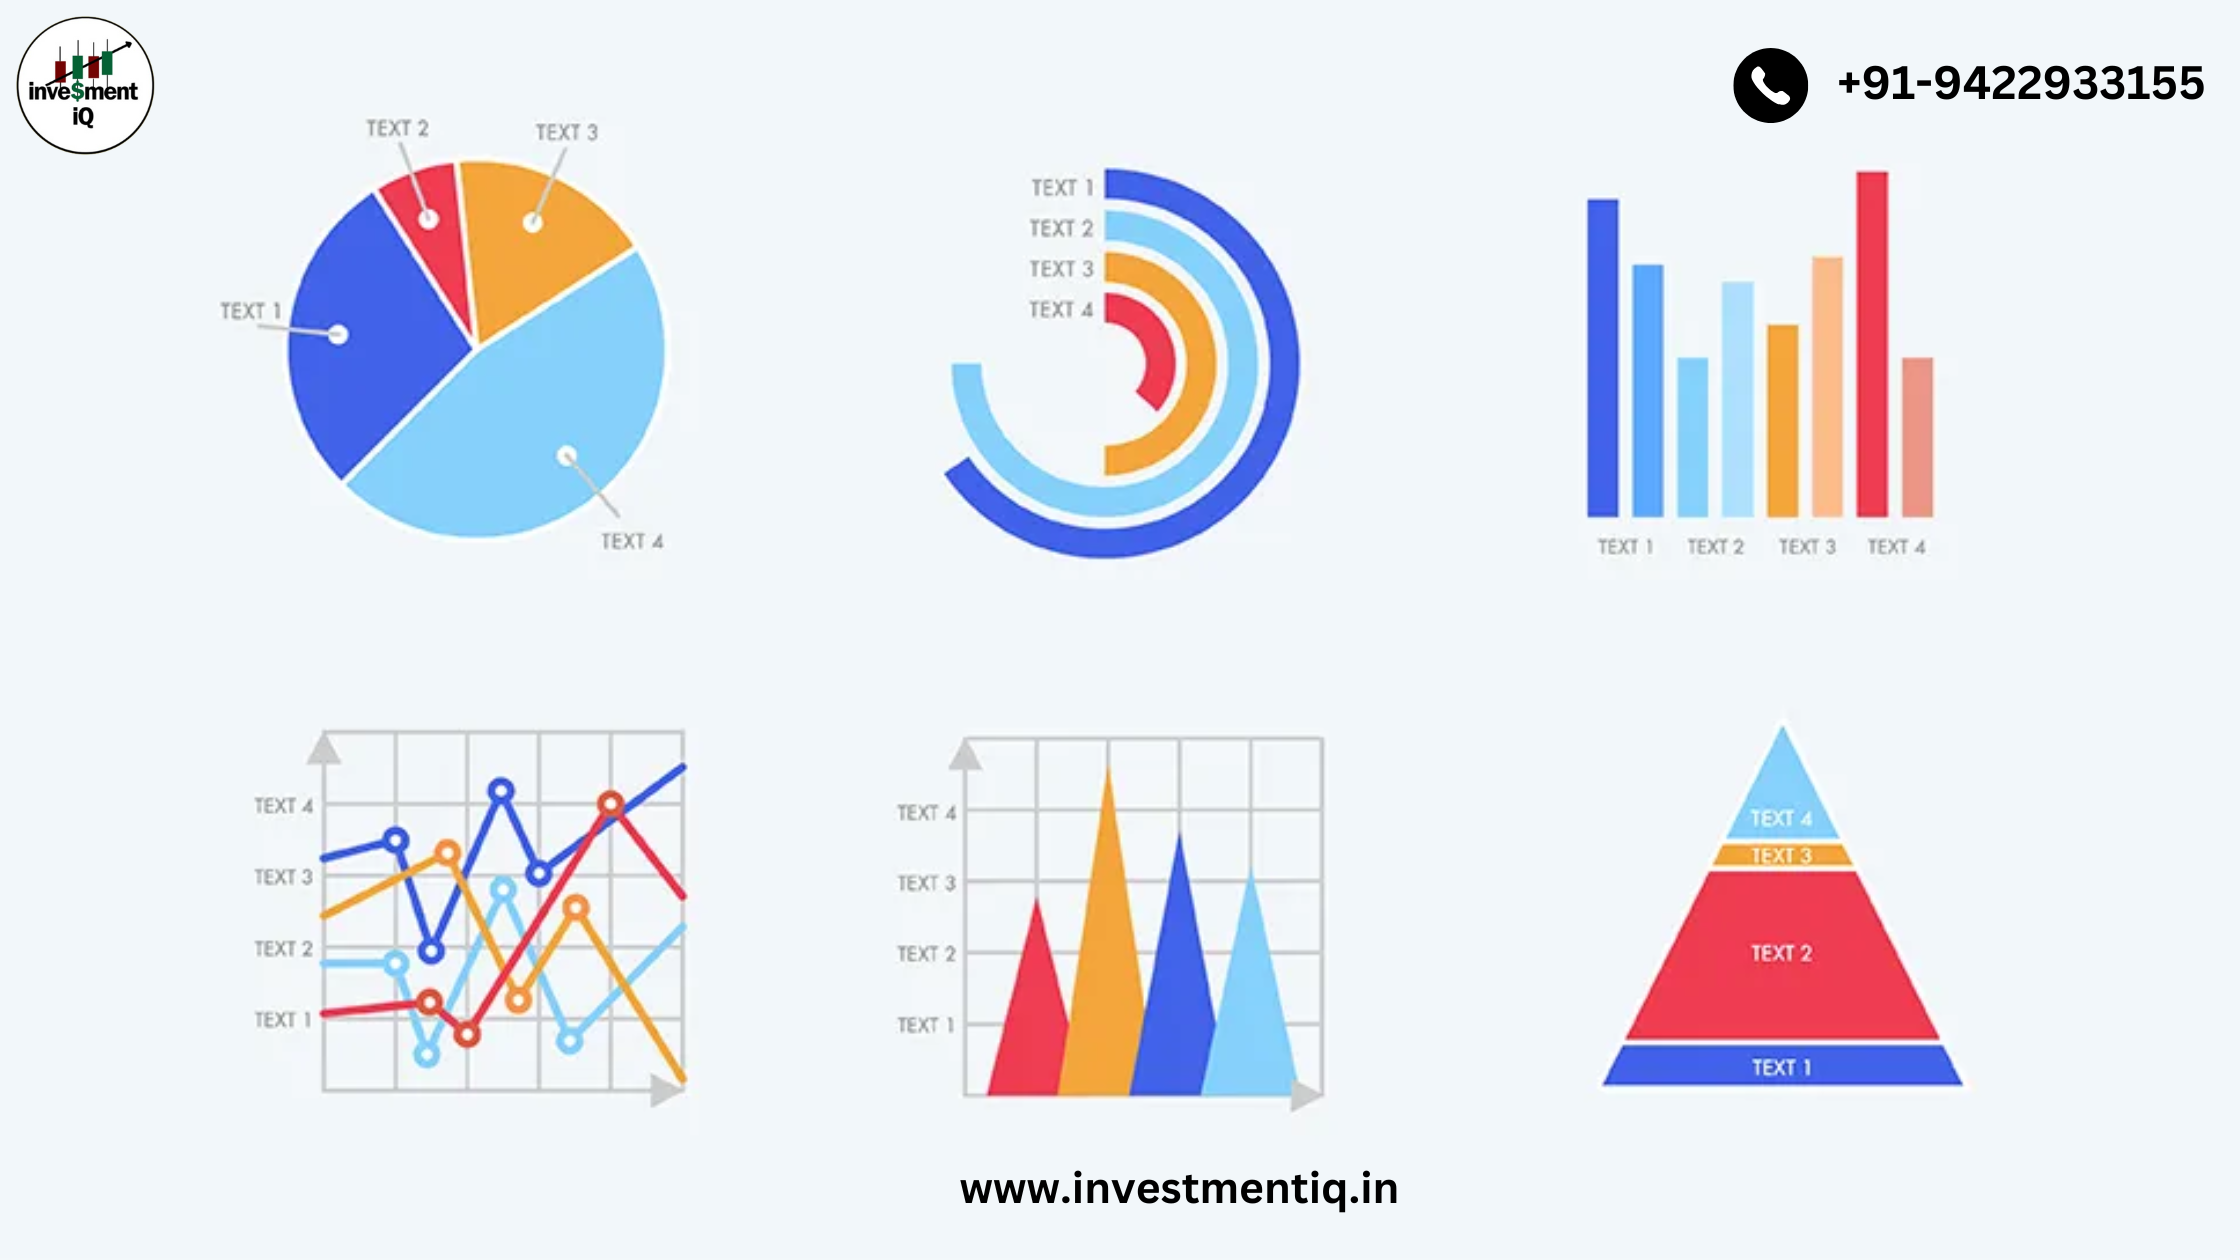
Chart Data Charts are created from data such as price data and index data. Price Data Exchanges record the price and number of shares for each stock transaction, which is…
The Value of Technical Analysis The reason technical analysis has value is that directional price moves are often sustained for a period of time, allowing analysts to detect and profit…
Defining Technical Analysis The study of price and volume fluctuations over time is known as technical analysis. Financial charts are typically used in technical analysis to assist in the understanding…
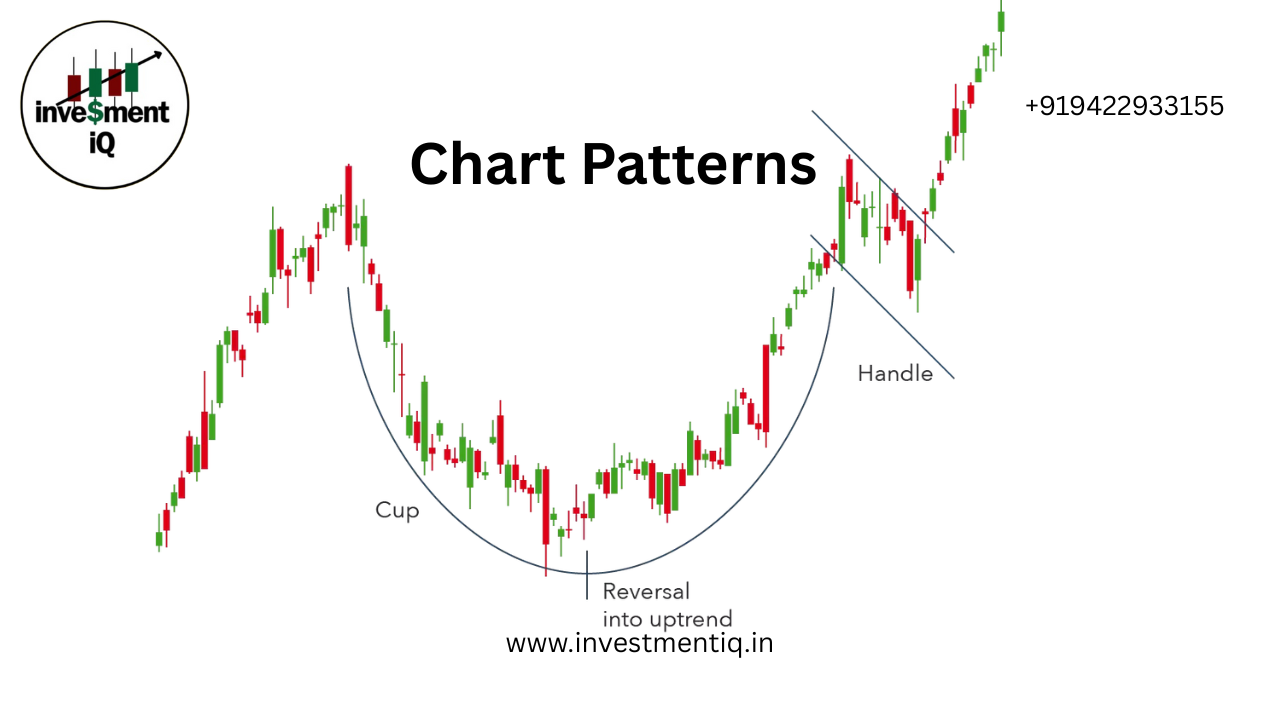
Why Are Chart Patterns Important? The forces of supply and demand drive prices in the financial market. Who is winning—the sellers or the buyers? In order to determine whether a market is heading upward, downward, or sideways, chart patterns offer a visual depiction of the conflict between buyers and sellers. You can make better buying and selling judgments if you are aware of this. Numerous chart designs are available. The majority fall into one of two general categories: continuation patterns or reversal patterns. While continuation patterns suggest the price trend will continue following a brief consolidation, reversal patterns indicate a change in the trend. In the StockCharts platform, you can scan for various chart patterns in the Predefined Scans available in the…
IntroductionAs we step into 2025, evolving market trends, technological innovations, and global events continue to shape investment strategies. Whether you're a seasoned investor or just starting out, understanding the top-performing…
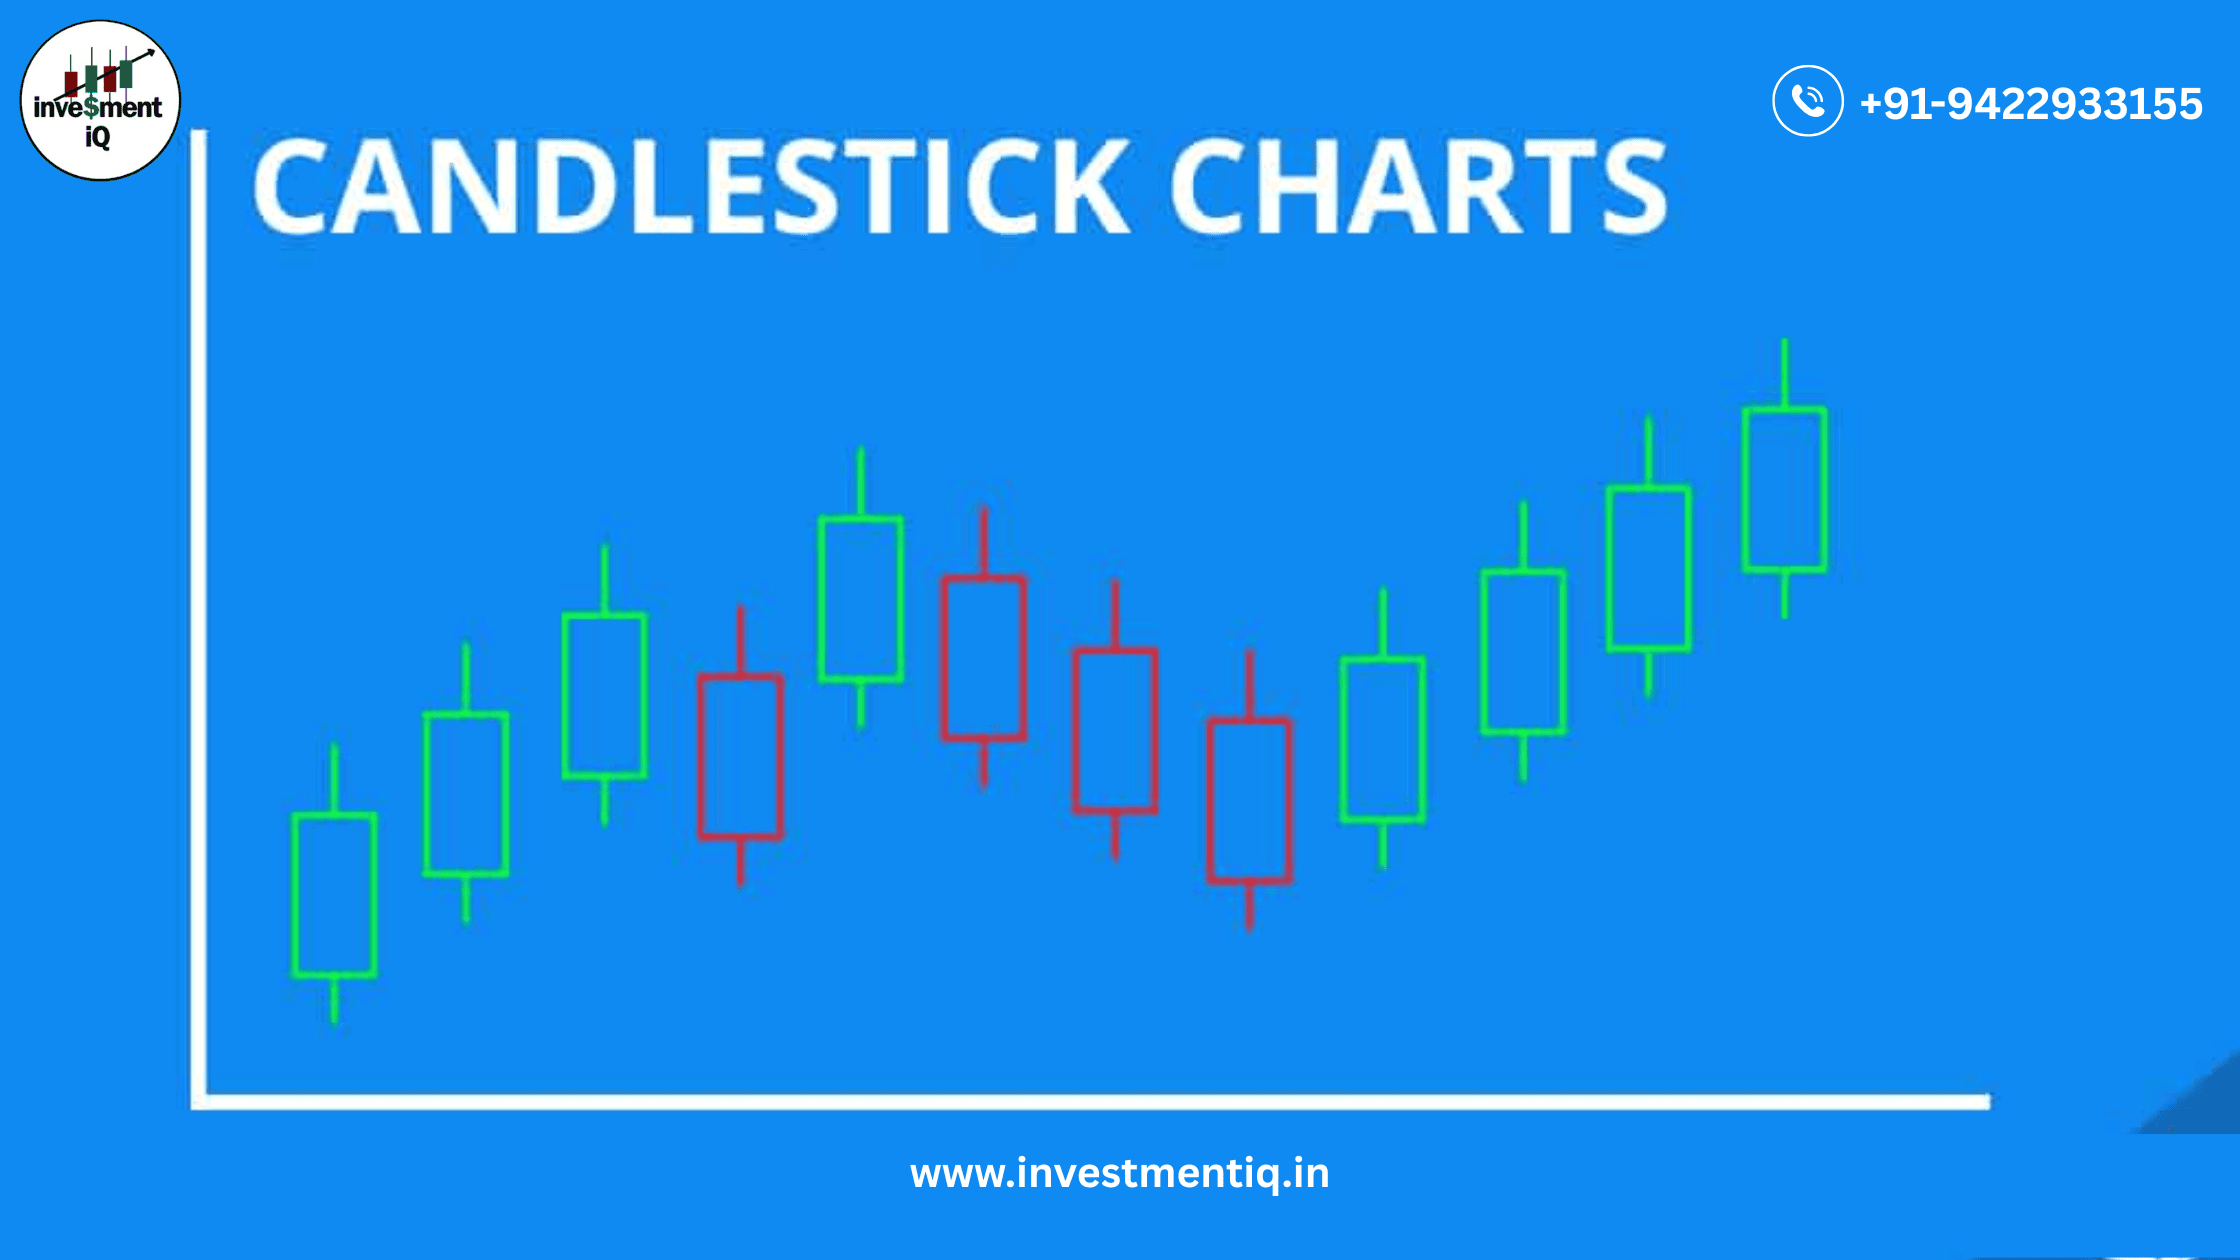
Candlesticks and Traditional Chart Analysis Benefits of Candlestick Charts Candlestick charts have merits as a charting system, Candlesticks and traditional chart analysis), but they also confirm signals generated by other…
Chart Data Chart Data Charts are created from data such as price data and index data. Price Data Exchanges record the price and number of shares for each stock transaction,…
Defining Technical Analysis Defining Technical Analysis Technical analysis is the study of price and volume changes over time. Technical analysis usually involves using financial charts to help study these changes.…
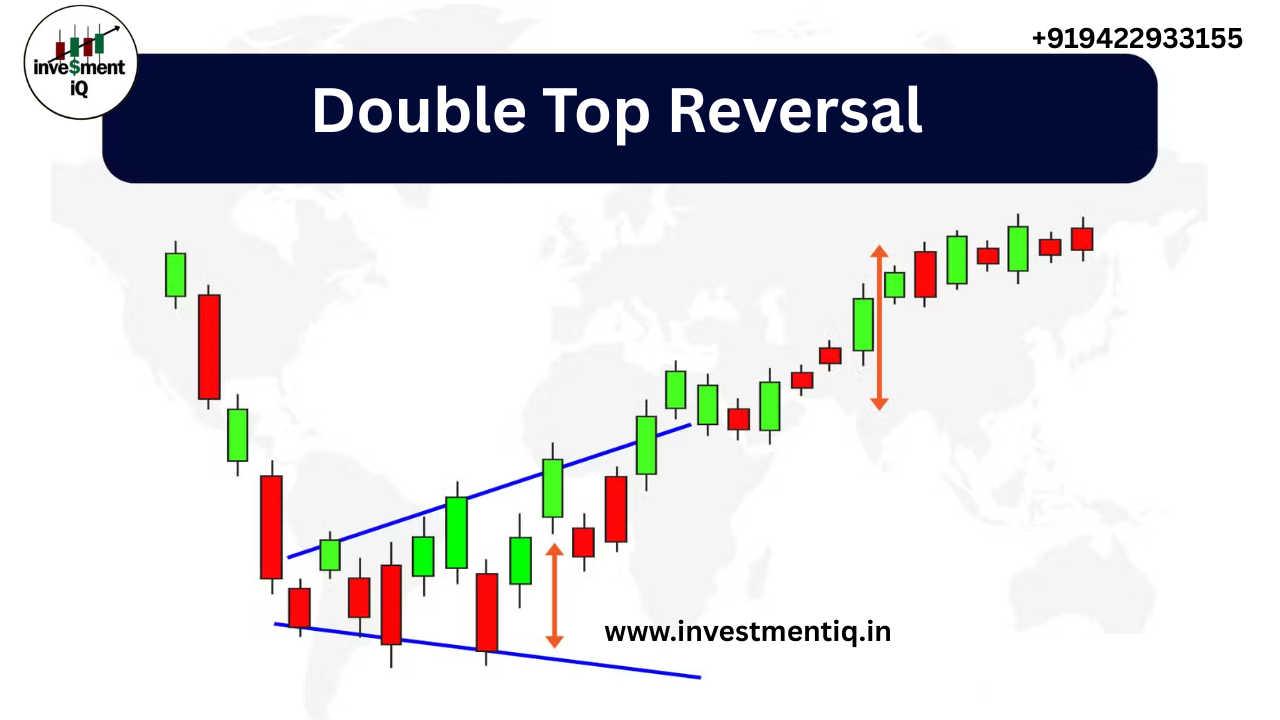
Explore the Double Top Reversal chart pattern and learn to identify, interpret, and trade this common bearish reversal pattern. A common bearish reversal pattern on bar, line, and candlestick charts is the Double Top Reversal.As the name suggests, the pattern consists of two about equal peaks that are followed by a mild dip. The traditional Double Top Reversal pattern indicates at least an intermediate-term shift from bullish to bearish, though there may be variances. An illustration of a Double Top Reversal can be seen in the chart below. Example of a classic Double Top Reversal…