How to Use Bollinger Bands for Smarter Trading Decisions
Have you ever wondered how traders seem to predict market moves with such confidence? While there’s no crystal ball in the world of finance, there are powerful tools that help…

🔍 Introduction MACD vs. PMO—which trading indicator should you trust more in 2025? Whether you’re a beginner investor or a company employee looking to understand the markets better, understanding how…
What Is the Detrend Price Oscillator (DPO)? An indicator called the Detrended Price Oscillator (DPO) was created to separate price trend and facilitate cycle identification. Since DPO is based on a displaced moving average, it does not extend to the latest date. However, since DPO is not a momentum oscillator, alignment with the most recent date is not a problem. Rather, cycle length is estimated and cycle highs and lows are identified using DPO. Calculation Copy Price {X/2 + 1} periods ago less the X-period simple moving average. X refers to the number…
PMO Configurations Sideways Wiggle A typical PMO formation is seen in the accompanying chart, which highlights the fact that not all PMO crossover signals may be interpreted literally. PMO movement during a consistent upward price trend is represented by the red-circled area. The PMO travels horizontally since the price movement is not very volatile. The fact that the PMO remains above the zero line testifies to the strength of the price move; however, minor zigzags in price…
Overbought/Oversold Indicator in PMO of -2025 The PMO can assist in identifying whether a price index is overbought or oversold, as illustrated below. The S&P 500 index's five-year chart, which is shown below, shows a variety of extreme market circumstances. A price reversal is frequently indicated when the PMO approaches or breaks the typical range of +2.5 (overbought) to -2.5 (oversold) for this index. The PMO is a rather good indicator of an intermediate-term shift in the direction of prices when it shifts at or above the extremes of its typical range. While +2.5 to -2.5 is the usual range for broad stock market indexes, each price index will have its own…
Interpreting the CCI CCI measures the difference between a security's price change and its average price change. Strong prices are indicated by high positive readings, which demonstrate that prices are significantly above average. Low negative readings are a sign of weakness since they suggest that prices are much below their average. The CCI can be used as a coincident or leading indicator.…
What Is the Commodity Channel Index? Developed by Donald Lambert and featured in Commodities magazine in 1980, the Commodity Channel Index (CCI) is a versatile indicator that can identify a…
What Is the %B Indicator? The price of a securities is measured by the %B Indicator in relation to the upper and lower Bollinger Bands. It can be used to determine the strength of a trend and spot overbought or oversold situations. It can assist you in identifying entry points inside a particular trend when combined with other indicators, such as the Money Flow Index (MFI). All things considered, the %B is a flexible instrument that can improve your capacity to assess and react to markets. There are six basic relationship levels: %B is below 0 when price is below the lower band %B equals 0 when…
Average True Range Percent (ATRP) Investment iq offers the ATRP, which is a variant of the ATR. The Average True Range (ATR) and ATRP both quantify volatility, but they are not the same. Since ATRP is expressed as a percentage, you can use it to compare the ATR values of several securities. The ATR is divided by the closing price, and the result is multiplied by 100 to determine the ATRP.A copy ATRP = (ATR / Close) * 100 Using ATRP With .investmentiq In investmentiq, you can view multiple charts simultaneously, making…
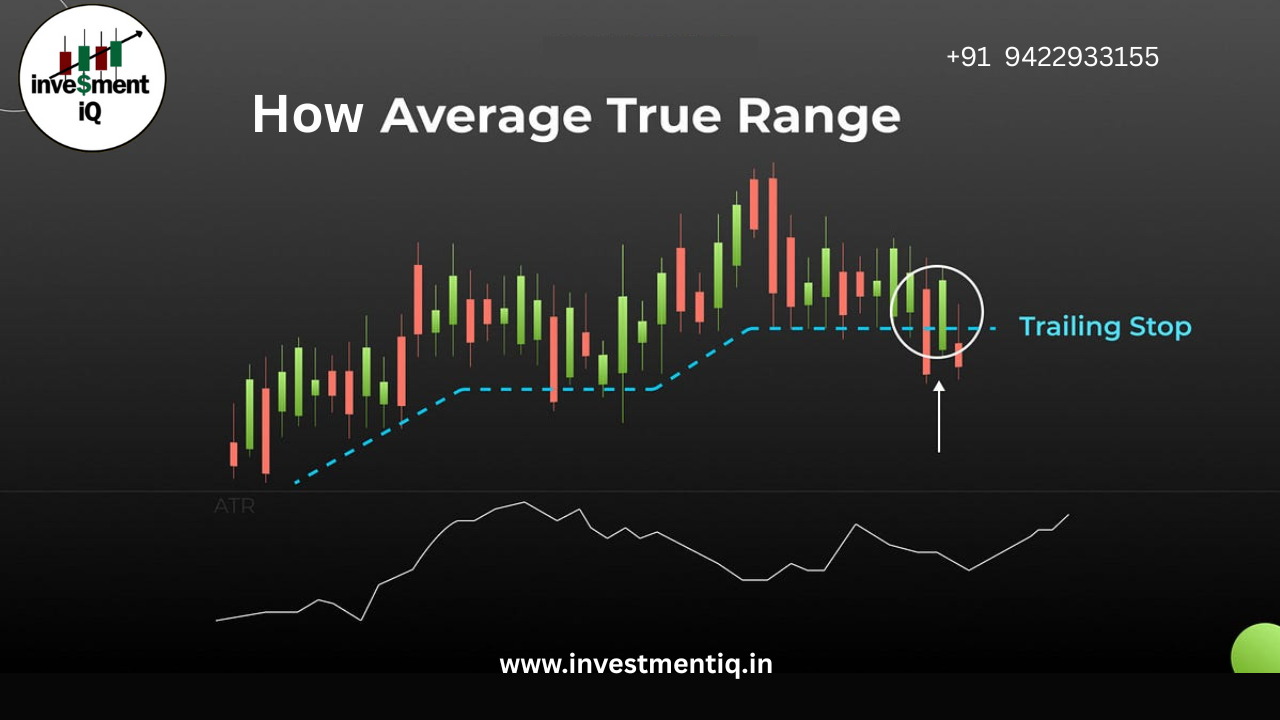
"How to Calculate ATR? The Average True Range (ATR) can be computed intraday, daily, weekly, or monthly and is typically based on 14 periods. The ATR in this case will be calculated using daily data. The initial 14-day ATR is the average of the daily TR values over the previous 14 days, and the first TR value is just the High minus the Low because there must be a beginning. Then, using the ATR value from the prior period, Wilder attempted to smooth the data.A copy Current ATR = [(Prior ATR x 13) + Current TR] / 14 - Multiply the previous 14-day ATR by 13. - Add…