The Basis of Technical Analysis
At the turn of the century, the Dow Theory laid the foundations for what would later become modern technical analysis. Dow Theory wasn't presented as one complete amalgamation but rather…
Dominate the Markets with Smart Technical Analysis | TA 101 – Part 17 Smart Technical Analysis Comparison Charting Welcome to Part our Technical Analysis 101 Series – "Dominate the Markets…
Dominate the Markets with Smart Technical Analysis | TA 101 – Part 16 Smart Technical Analysis of Candlestick Patterns A trader can gain insight into the current market psychology and…
Dominate the Markets with Smart Technical Analysis TA 101 – Part 15 Markets with Smart Technical Analysis Gaps Price charts often have blank spaces known as gaps. They represent times…
Dominate the Markets with Smart Technical Analysis | TA 101 – Part 14 Dominate the Markets with Smart Technical Analysis Fibonacci Lines Welcome to Part our Technical Analysis 101 Series…
Dominate the Markets with Smart Technical Analysis | TA 101 – Part 13 The Infamous Head and Shoulders Reversal Pattern Welcome to our Technical Analysis 101 Series – "Dominate the…
Advance-Decline Volume Line A cumulative breadth indicator derived from Net Advancing Volume. What Is the Advance-Decline Volume Line? The Advance-Decline Volume Line (AD Volume Line) is a breadth indicator based…
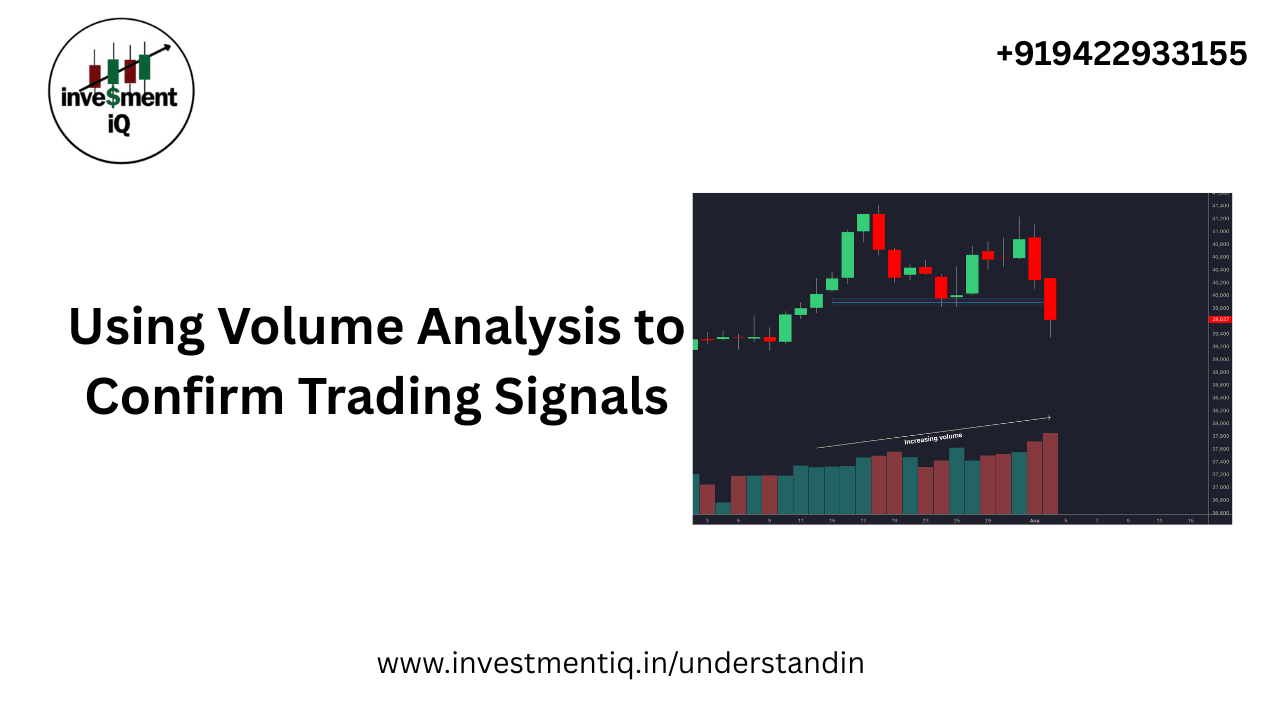
Dominate the Markets with Smart Technical Analysis-TA 101 – Part 12 Volume Confirmation of Price Patterns When identifying potential price patterns on a chart, it is crucial to try and…
Dominate the Markets with Smart Technical Analysis-TA 101TA 101 – Part 11 Markets with Smart Technical Analysis Price Patterns When the market does not agree on a stock's value, price…
Lagging indicators, often known as trend-following indicators, do exactly what their name suggests: they track the price activity. These signs will almost never drive a security's price. When stocks or markets exhibit robust trends, trend-following indicators perform well. As long as the trend continues, they are intended to draw traders in and hold them there. As a result, these indicators are useless in sideways or trading markets. Trend-following indicators are likely to produce a lot of false signals and whipsaws when employed in trading markets. MACD and moving averages (exponential, basic, weighted, and variable) are two common trend-following indicators. The S&P 500 ($SPX) is seen in the above chart along with its 20- and 100-day simple moving averages. Seven signals were produced during the two years shown in the figure using a moving average crossover. The system would have made a huge profit throughout these two years. The significant trends that emerged from October 1997 to August 1998 and from November 1998 to August 1999 are to blame for this. Observe, however, that the whipsaws commence as soon as the index begins to move laterally within a trading range. Within a few days, the purchase, sell, and sell signals in November 1997, August 1999, and September 1999 were reversed. There would have been fewer whipsaws if these moving averages (50- and 200-day moving averages) had been longer.Had these moving averages been shorter (10 and 50-day moving average), there would have been more whipsaws,…