Read more about the article Dominate the Markets with Smart Technical Analysis | TA 101 – Part 16
Master powerful chart patterns and indicators in TA 101 Part 16. Take your trading to the next level with smart technical analysis strategies!

Dominate the Markets with Smart Technical Analysis | TA 101 – Part 16

Dominate the Markets with Smart Technical Analysis | TA 101 – Part 16 Smart Technical Analysis of Candlestick Patterns A trader can gain insight into the current market psychology and…

Continue ReadingDominate the Markets with Smart Technical Analysis | TA 101 – Part 16
Read more about the article Dominate the Markets with Smart Technical Analysis | TA 101 – Part 14
Master the next level of trading with Part 14 of TA 101 – advanced indicators, volume insights, and smarter decision-making.

Dominate the Markets with Smart Technical Analysis | TA 101 – Part 14

Dominate the Markets with Smart Technical Analysis | TA 101 – Part 14 Dominate the Markets with Smart Technical Analysis Fibonacci Lines Welcome to Part our Technical Analysis 101 Series…

Continue ReadingDominate the Markets with Smart Technical Analysis | TA 101 – Part 14
Read more about the article Advance-Decline Volume Line
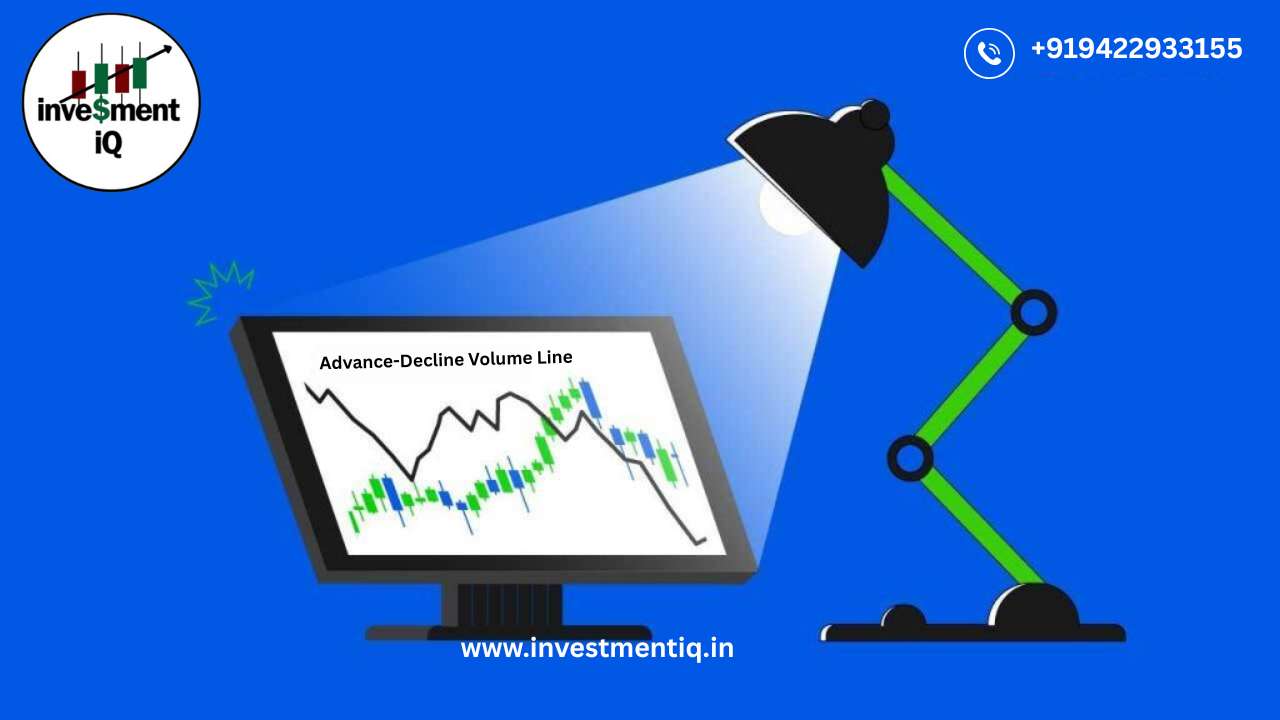
📈 Not all rallies are created equal — volume tells the real story. The Advance-Decline Volume Line reveals if the majority of trading volume supports the trend. 🔍 Use it to confirm strength or spot hidden weakness.

Advance-Decline Volume Line

Advance-Decline Volume Line A cumulative breadth indicator derived from Net Advancing Volume. What Is the Advance-Decline Volume Line? The Advance-Decline Volume Line (AD Volume Line) is a breadth indicator based…

Continue ReadingAdvance-Decline Volume Line
Read more about the article What is Lagging Indicators
📉 What Are Lagging Indicators? Lagging indicators help confirm trends after they form, giving you reliable entry and exit signals. 📊 Learn when to use them with smart trading strategies at www.investmentiq.in #LaggingIndicators #StockMarketEducation #TechnicalAnalysis #investmentiQ #SmartTrading

What is Lagging Indicators

Lagging indicators, often known as trend-following indicators, do exactly what their name suggests: they track the price activity. These signs will almost never drive a security's price. When stocks or markets exhibit robust trends, trend-following indicators perform well. As long as the trend continues, they are intended to draw traders in and hold them there. As a result, these indicators are useless in sideways or trading markets. Trend-following indicators are likely to produce a lot of false signals and whipsaws when employed in trading markets. MACD and moving averages (exponential, basic, weighted, and variable) are two common trend-following indicators. The S&P 500 ($SPX) is seen in the above chart along with its 20- and 100-day simple moving averages. Seven signals were produced during the two years shown in the figure using a moving average crossover. The system would have made a huge profit throughout these two years. The significant trends that emerged from October 1997 to August 1998 and from November 1998 to August 1999 are to blame for this. Observe, however, that the whipsaws commence as soon as the index begins to move laterally within a trading range. Within a few days, the purchase, sell, and sell signals in November 1997, August 1999, and September 1999 were reversed. There would have been fewer whipsaws if these moving averages (50- and 200-day moving averages) had been longer.Had these moving averages been shorter (10 and 50-day moving average), there would have been more whipsaws,…

Continue ReadingWhat is Lagging Indicators
Read more about the article Dominate the Markets with Smart Technical Analysis-TA 101 – Part 10
🏁 The final chapter of TA 101 is here! Wrap up your technical analysis journey with the ultimate strategies that tie it all together. 📊 Strategy building 📈 Trade journaling 🧠 Continuous improvement This is how smart traders stay ahead — consistently. #TA101 #FinalEpisode #SmartTrading #StockMarketEducation #TradingStrategies #ChartMastery

Dominate the Markets with Smart Technical Analysis-TA 101 – Part 10

Technical Analysis of Volume Confirmation In an uptrend, volume should increase as prices rise and decrease as prices fall. As long as this pattern continues, volume is confirming the uptrend. …

Continue ReadingDominate the Markets with Smart Technical Analysis-TA 101 – Part 10
Read more about the article Strengths of Fundamental Analysis
Explore how fundamental analysis uncovers a company’s true value using financial health, earnings, and economic data.

Strengths of Fundamental Analysis

Strengths of Fundamental Analysis Long-term Trends For long-term investments based on extremely long-term patterns, fundamental analysis works well. Patient investors who choose the appropriate sector groups or companies can gain from the ability to see and forecast long-term changes in the economy, population, technology, or consumer behavior. Learn more about this Value Spotting Finding businesses that offer high value will be made easier with the aid of sound basic analysis. Some of the most renowned investors have a long-term and value-oriented perspective. John Neff, Warren Buffett, and Graham and Dodd are regarded as value investing evangelists. Companies with significant assets, a solid balance sheet, consistent earnings, and longevity can be found with the aid of fundamental research. Business Acumen One of the most obvious, but less tangible, rewards of…

Continue ReadingStrengths of Fundamental Analysis