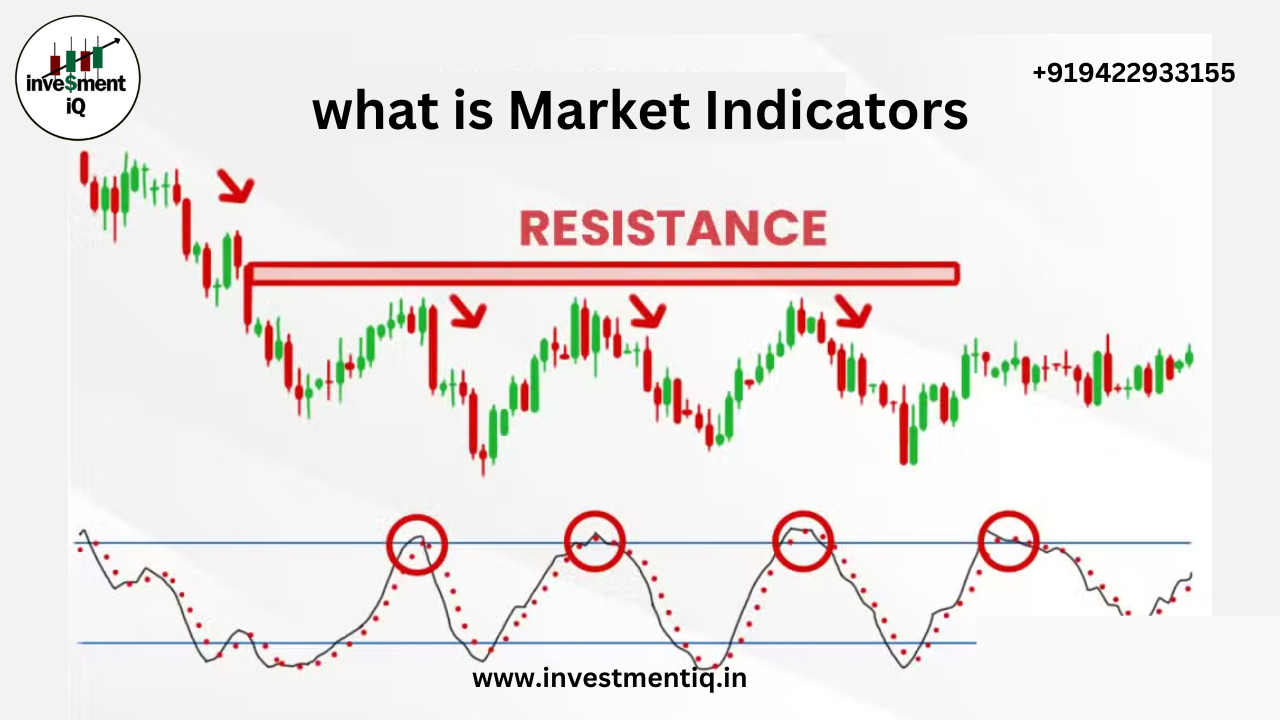
Leading indicators are intended to track price movements, as their name suggests. The majority show a type of price momentum over a predetermined lookback period, or the number of periods that are utilized to compute the indicator. For instance, the last 20 days of price activity, or roughly a month, would be used in the computation of a 20-day stochastic oscillator. All previous price movements would be disregarded. The Commodity Channel Index (CCI), Momentum, Relative Strength Index (RSI), Stochastic Oscillator, and Williams %R are a few of the more often used leading indicators. Momentum Oscillators Momentum oscillators are a common type of leading indicator. In general, momentum quantifies how quickly the price of an asset changes. Price momentum rises as a security's price does. The increase in momentum increases with the speed at which the security climbs (the larger the period-over-period price change). Momentum will slow as soon as this climb starts to slow. Momentum actually starts to drop from prior high levels when a security starts to trade flat. Declining momentum in the face of sideways trade, however, does not necessarily indicate a bear market. It merely indicates that momentum is gathering back to a level that is more median. Momentum indicators quantify price fluctuations using a variety of formulas. An metric of momentum called the relative strength index (RSI) analyzes the average price change during rising and falling periods. From October until the end of November, RSI increased on the IBM chart. The stock rose from the upper 60s to the low 80s throughout this time. The RSI experienced a significant decline (blue lines) during the first part of December while the stock was trading sideways. The stock's consolidation was healthy and rather typical. It would be anticipated that flat price movement would result in a drop in RSI (and momentum) from these high levels (around 70). If RSI were trading around 50…