Read more about the article Average Directional Index (ADX)
The ADX helps traders identify whether the market is trending and how strong the current trend is, regardless of direction.

Average Directional Index (ADX)

What Is the Average Directional Index (ADX)? Welles Wilder created a trading method that consists of a set of directional movement indicators called the Average Directional Index (ADX), Minus Directional Indicator (-DI), and Plus Directional Indicator (+DI). While commodities and daily prices were the primary focus of Wilder's Directional Movement System, equities can also benefit from the use of these indicators. Positive and negative directional movement form the backbone of the Directional Movement System. Wilder determined directional movement by comparing the difference…

Continue ReadingAverage Directional Index (ADX)
Read more about the article Introduction to Market Indicators
📊 New to trading or investing? Start with the basics of market indicators — your roadmap to understanding the economy and predicting market moves. 🔍 Know what drives price action beyond the charts!

Introduction to Market Indicators

Introduction to Market Indicators Market Indicators are used to measure the health of a group of related stocks, usually by measuring group participation in a trend. The group can be…

Continue ReadingIntroduction to Market Indicators
Read more about the article Bullish Percent Index (BPI)
📈 Want to know how many stocks are truly in bullish territory? The Bullish Percent Index (BPI) tracks the percentage of stocks on buy signals, helping you measure market sentiment and spot key turning points. ✔️ A favorite among seasoned technical analysts.

Bullish Percent Index (BPI)

Bullish Percent Index (BPI) A breadth indicator derived from the percentage of stocks on P&F Buy signals. What Is the Bullish Percent Index? The Bullish Percent Index (BPI) is a…

Continue ReadingBullish Percent Index (BPI)
Read more about the article High-Low Index
Track market strength and direction with the High-Low Index — a powerful tool for identifying bullish and bearish trends.

High-Low Index

High-Low Index The 10-day moving average of the Record High Percent Index, which is a breadth indicator (see below). Record High Percent, which is based on new 52-week highs and lows, serves as the basis for the High-Low Index, a breadth indicator. New highs divided by new highs + new lows is the Record High Percent. A smoothed version of the Record High Percent, the High-Low Index is just a 10-day SMA of the Record High Percent. This article will describe how to determine the High-Low Index's direction and how to define a trading bias using the absolute level. Welcome to Part our Technical Analysis 101…

Continue ReadingHigh-Low Index
Read more about the article What Does DPO Measure?
"Understand what the Detrended Price Oscillator (DPO) measures and how it helps isolate short-term price cycles – from InvestmentIQ.in"

What Does DPO Measure?

What Does DPO Measure? The difference between a previous price and a moving average is measured by the Detrended Price Oscillator (DPO). Remember that DPO is also shifted to the left. The indicator oscillates above/below zero as prices move above/below the displaced moving average. Chart 2 shows the S&P 500 ETF (SPY) with a 20-day…

Continue ReadingWhat Does DPO Measure?
Read more about the article ATR Bands
ATR Bands help traders assess market volatility and spot potential breakout or reversal levels with greater accuracy.

ATR Bands

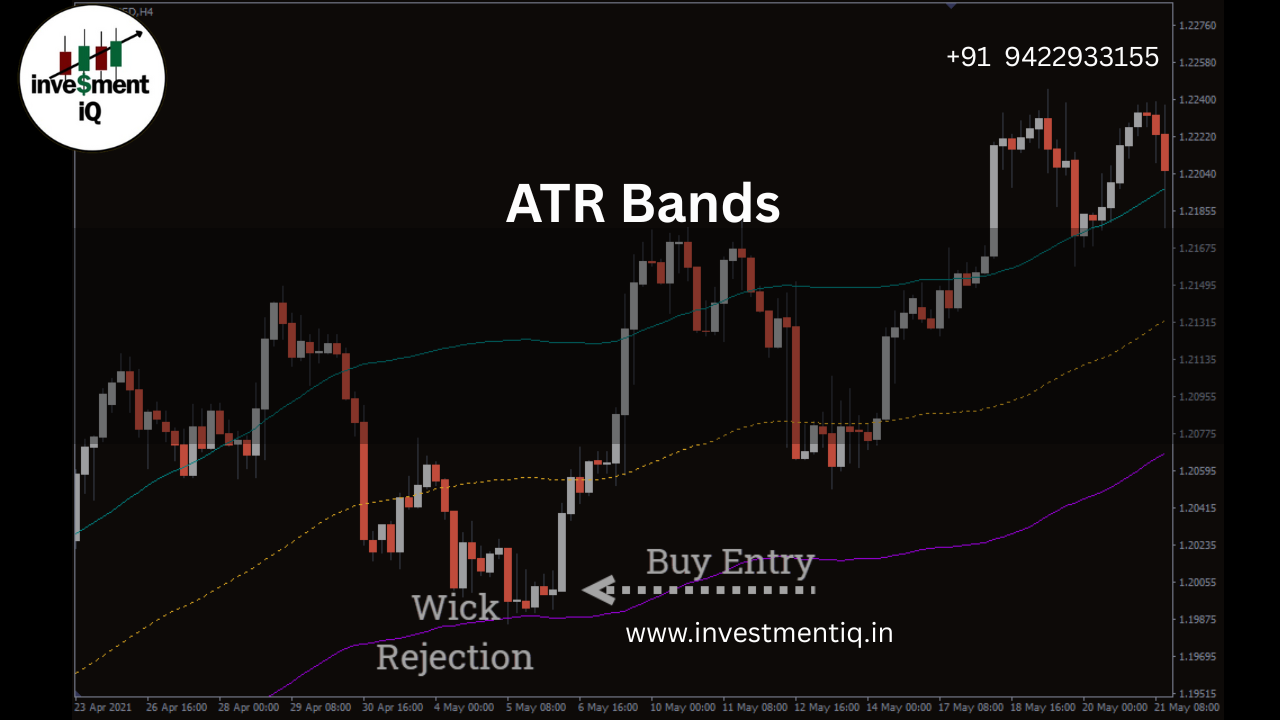
What Are ATR Bands? An indicator based on volatility, ATR Bands plot bands above and below the underlying price's moving average. ATR Bands, which build upon J. Welles Wilder's Average True Range (ATR) concept, provide a visual depiction of price volatility around its central moving average. How to Interpret ATR Bands ATR Bands can be used in a variety of ways to improve your trading strategies or evaluate a market.Here are some suggestions regarding how to use and interpret them. Analyzing Volatility ATR Bands are used by most traders to measure market volatility.Through the visual projection of volatility levels surrounding a stock's price, the  bands can assist you in evaluating the state of the market and then modifying your tactics accordingly. Setting Stop-Loss and Take-Profit Levels Setting stop-loss and takeprofit levels is another popular application for ATR Bands. You can allow your trades to vary without  being prematurel stopped out by setting stop-loss orders a specific multiple of the ATR below the entry price. In a similar manner, to match profit objectives with market volatility, take-profit levels can be established by multiplying the ATR above the entry price. Position Sizing ATR Bands can be used to help in position size. You can calculate the right trade size in relation to the asset's volatility by evaluating the ATR value. While lower volatility might permit larger positions, higher volatility (shown by a higher ATR) might recommend smaller position sizes to mitigate …

Continue ReadingATR Bands
Read more about the article What Is the Aroon Oscillator?
The Aroon Oscillator measures the difference between Aroon Up and Aroon Down to identify strong trends and reversals.

What Is the Aroon Oscillator?

What Is the Aroon Oscillator? The Aroon Oscillator is the difference between Aroon-Up and Aroon-Down. These two indicators are usually plotted together for easy comparison, but chartists can also view…

Continue ReadingWhat Is the Aroon Oscillator?
Read more about the article Detrended Price Oscillator (DPO)-2025
"The Detrended Price Oscillator (DPO) is used to remove long-term trends and highlight short-term cycles. Learn how to use it on InvestmentIQ.in"

Detrended Price Oscillator (DPO)-2025

What Is the Detrend Price Oscillator (DPO)? An indicator called the Detrended Price Oscillator (DPO) was created to separate price trend and facilitate cycle identification. Since DPO is based on a displaced moving average, it does not extend to the latest date. However, since DPO is not a momentum oscillator, alignment with the most recent date is not a problem. Rather, cycle length is estimated and cycle highs and lows are identified using DPO. Calculation Copy Price {X/2 + 1} periods ago less the X-period simple moving average. X refers to the number…

Continue ReadingDetrended Price Oscillator (DPO)-2025
Read more about the article PMO Configurations-2025
"Explore the best PMO (Price Momentum Oscillator) configurations for 2025 to fine-tune your market analysis – from InvestmentIQ.in"

PMO Configurations-2025

PMO Configurations Sideways Wiggle A typical PMO formation is seen in the accompanying chart, which highlights the fact that not all PMO crossover signals may be interpreted literally. PMO movement during a consistent upward price trend is represented by the red-circled area. The PMO travels horizontally since the price movement is not very volatile. The fact that the PMO remains above the zero line testifies to the strength of the price move; however, minor zigzags in price…

Continue ReadingPMO Configurations-2025